

From Pixels to Priorities: Using Drone Surveys to Manage Your Orchards
Map-layer, zonal, and per-plant views that move you from seeing to doing; turning surveys into targeted scouting, timely interventions, and year-on-year improvements.

When people think mapping with drones, they think pictures. In modern orchards, the value is not in the picture; it’s in the pattern behind the picture.
The data you capture, the way you capture it, and how you translate it into targeted action. Ladies and gentlemen, that is how drone surveys pay for themselves.
Identifying emerging patterns and managing orchards and vineyards in a smarter way - a much better way - means knowing what the key data metrics are, and how they can be used. It’s your surefire entryway to taking meaningful action.
This post distils the essentials from Chapter 2 of my book Drone Data Metrics for Orchard Farming - a foundational guide to understanding the modern drone data stack, as well as touching on related blog content over here.
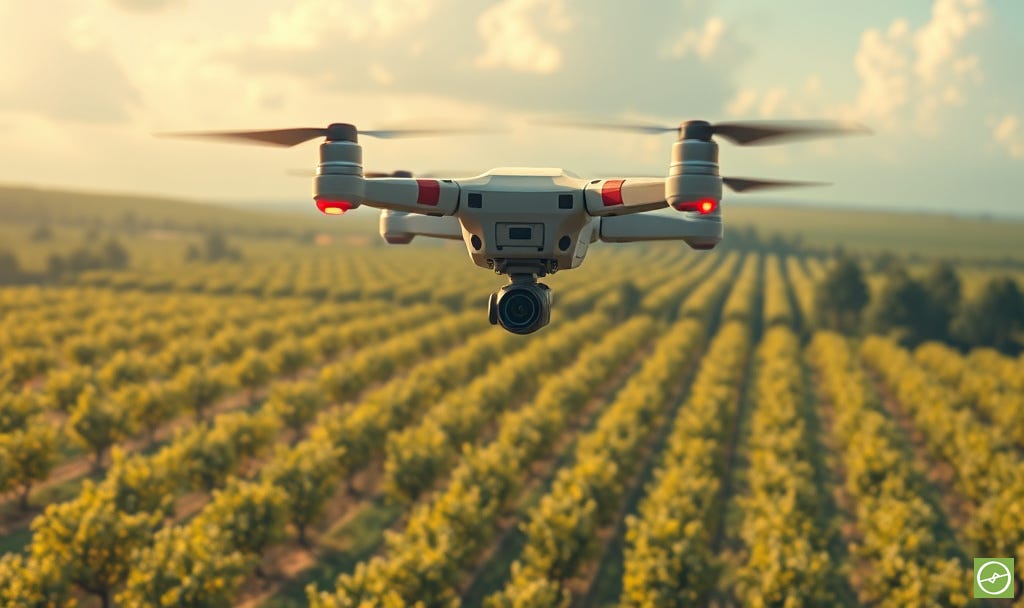
Why drones matter in perennial crops
Drones give you high-resolution, repeatable views of your orchards; and it’s fast enough to allow you to catch issues before they spread to be come systemic threats.
Their core advantage is timely information that supports irrigation adjustments, targeted inputs, and early pest or disease checks or to adjust spraying regimes.
The sensors do the seeing; while the workflow results turns seeing into doing.
A quick look at drone types
Multi-rotor: agile, easy to deploy, great for smaller blocks or complex terrain.
Fixed-wing: efficient coverage and longer flights for large areas.
VTOL: fixed-wing range plus vertical take-off flexibility.
Choose by terrain, block size, urgency, weather window, and the detail you need.
Sensors and “from flight to insight”
Sensors are the payload that capture light or heat across specific bands; the data becomes useful once processed into decision-ready layers. This is the bridge between flying and farming: raw pixels transformed into practical insights.
Four ways to access drone data
The fully serviced option (flight + processing + platform + insights).
Contract a pilot, and contract data processing separately.
Use an in-house pilot, and outsource processing.
Go the end-to-end in-house route (less common; higher overheads).
Pick a route that matches your scope, budget, capacity, timelines, risk appetite, and how often you expect to repeat surveys.
What to plan before you fly
Think through terrain and weather, crop and intended insights, battery and memory constraints, sensor swap needs, and technical support. Small practicalities compound into data integrity later.
If in doubt, opt to hire a professional.
Three core output “perspectives”
Map-layer perspectives: whole-block patterns and gradients.
Zonal perspectives: areas with similar values for targeted scouting and sampling.
Per-plant perspectives: tree or vine level differences that highlight outliers and change. Or clusters of individual plants that highlight patterns of interest or concern.
These differing granularities work together: map layers point to zones; zones are made of representative trees; and trees represent the real-world assets in the ground.
How and which of the perspectives you utilise during orchard analysis will depend on your goals and challenges, the orchard status, and the drone data metrics in question.
From images to action: a simple loop
Here's how it all goes down…
Survey: capture RGB imagery as standard, add multispectral and/or thermal as needed (personally, I highly recommend it).
Screen: look for contrasts and change - high vs low zones; persistent patterns and subtle clues alike.
Ground-truth: sample the strongest and weakest areas; test hypotheses. Get boots on the ground. Utilise industry expertise, and explore options and actions.
Act: adjust irrigation, nutrition, mange canopies, drainage, equipment, or operations. Aim for an approach that’s methodical yet swift.
Repeat: check what’s changed; tighten the loop. Outline your next steps.
Good drone maps are conversation starters; not the final word. They show you where to look, what to prioritise, and what to do next.
The big picture
The goal is not to collect all types of data on everything. It is to capture the right layers at the right time and turn them into reliable datasets, and confident, timely interventions. That is how you spend less, act faster, and farm smarter.
Put simply, build a workflow you can repeat.
Start with the layers that answer your most pressing questions, schedule scans when they matter, and ground-truth the outliers before you act.
Document what you change and resurvey on the same phenological stages so your maps become a season-on-season record, not a one-off picture.
Over time, that discipline compounds; patterns become plans, and plans become performance.
This post is adapted from Chapter 2: Key Data Metrics & UAVs, which you can find in my book, Drone Data Metrics for Orchard Farming.
The thinking starts here, but the real change starts when we take action.