

Per-tree Sampling Methods: Focusing on Outliers
Outlier trees can reveal underlying problems or unexpected up-sides. Learn how to use drone data to target these trees for smarter, ROI-focused sampling.

As drone data becomes more precise and actionable; farmers are increasingly able to zoom in on individual trees and make decisions at a finer level than ever before. One of the most effective (and underused) strategies at this resolution is outlier-focused sampling.
Whether you're working with NDRE, canopy volume, transpiration uniformity, or yield estimates, there's always a distribution of values across your orchard. Some trees fall far from the average…. and these are your outliers — often holding the most important agronomic clues.

Why Outliers Matter
Outlier values - whether high or low - can signal acute underlying issues, or reveal trees with exceptional performance under the same environmental and management conditions. This makes them highly valuable targets for material sampling, especially when budgets and time are limited.
For example:
A low-health (high stress) tree may be dealing with root disease, compaction, or localised nutrient deficiencies.
A high-performing tree might have better soil structure, superior rootstock adaptation, or other advantages worth learning from.
These instances are often overlooked as we tend to focus on poor performing areas. Disregarding these '“positive outliers” means missing opportunities and insights.
Either way, these trees tell a story the rest of the block can’t.
What to Sample (non-exhaustive list)
Outlier-based sampling can be used across many types of plant and soil material:
Leaf tissue (for nutrient levels or pest analysis)
Fruit (for quality assessments or size anomalies)
Plant sap (for Brix or in-season nutritional monitoring)
Soil (to investigate drainage, compaction, or nutrient pockets)
Roots (to check for nematodes, disease or vigour-limiting factors)
Paired with drone insights, this becomes a targeted, ROI-positive approach to problem-solving and opportunity-finding.
Practical Tips for Using Outlier Sampling
Field-tested tips to make your outlier sampling work smarter, not harder:
1. Use Distribution Visuals to Spot Extremes
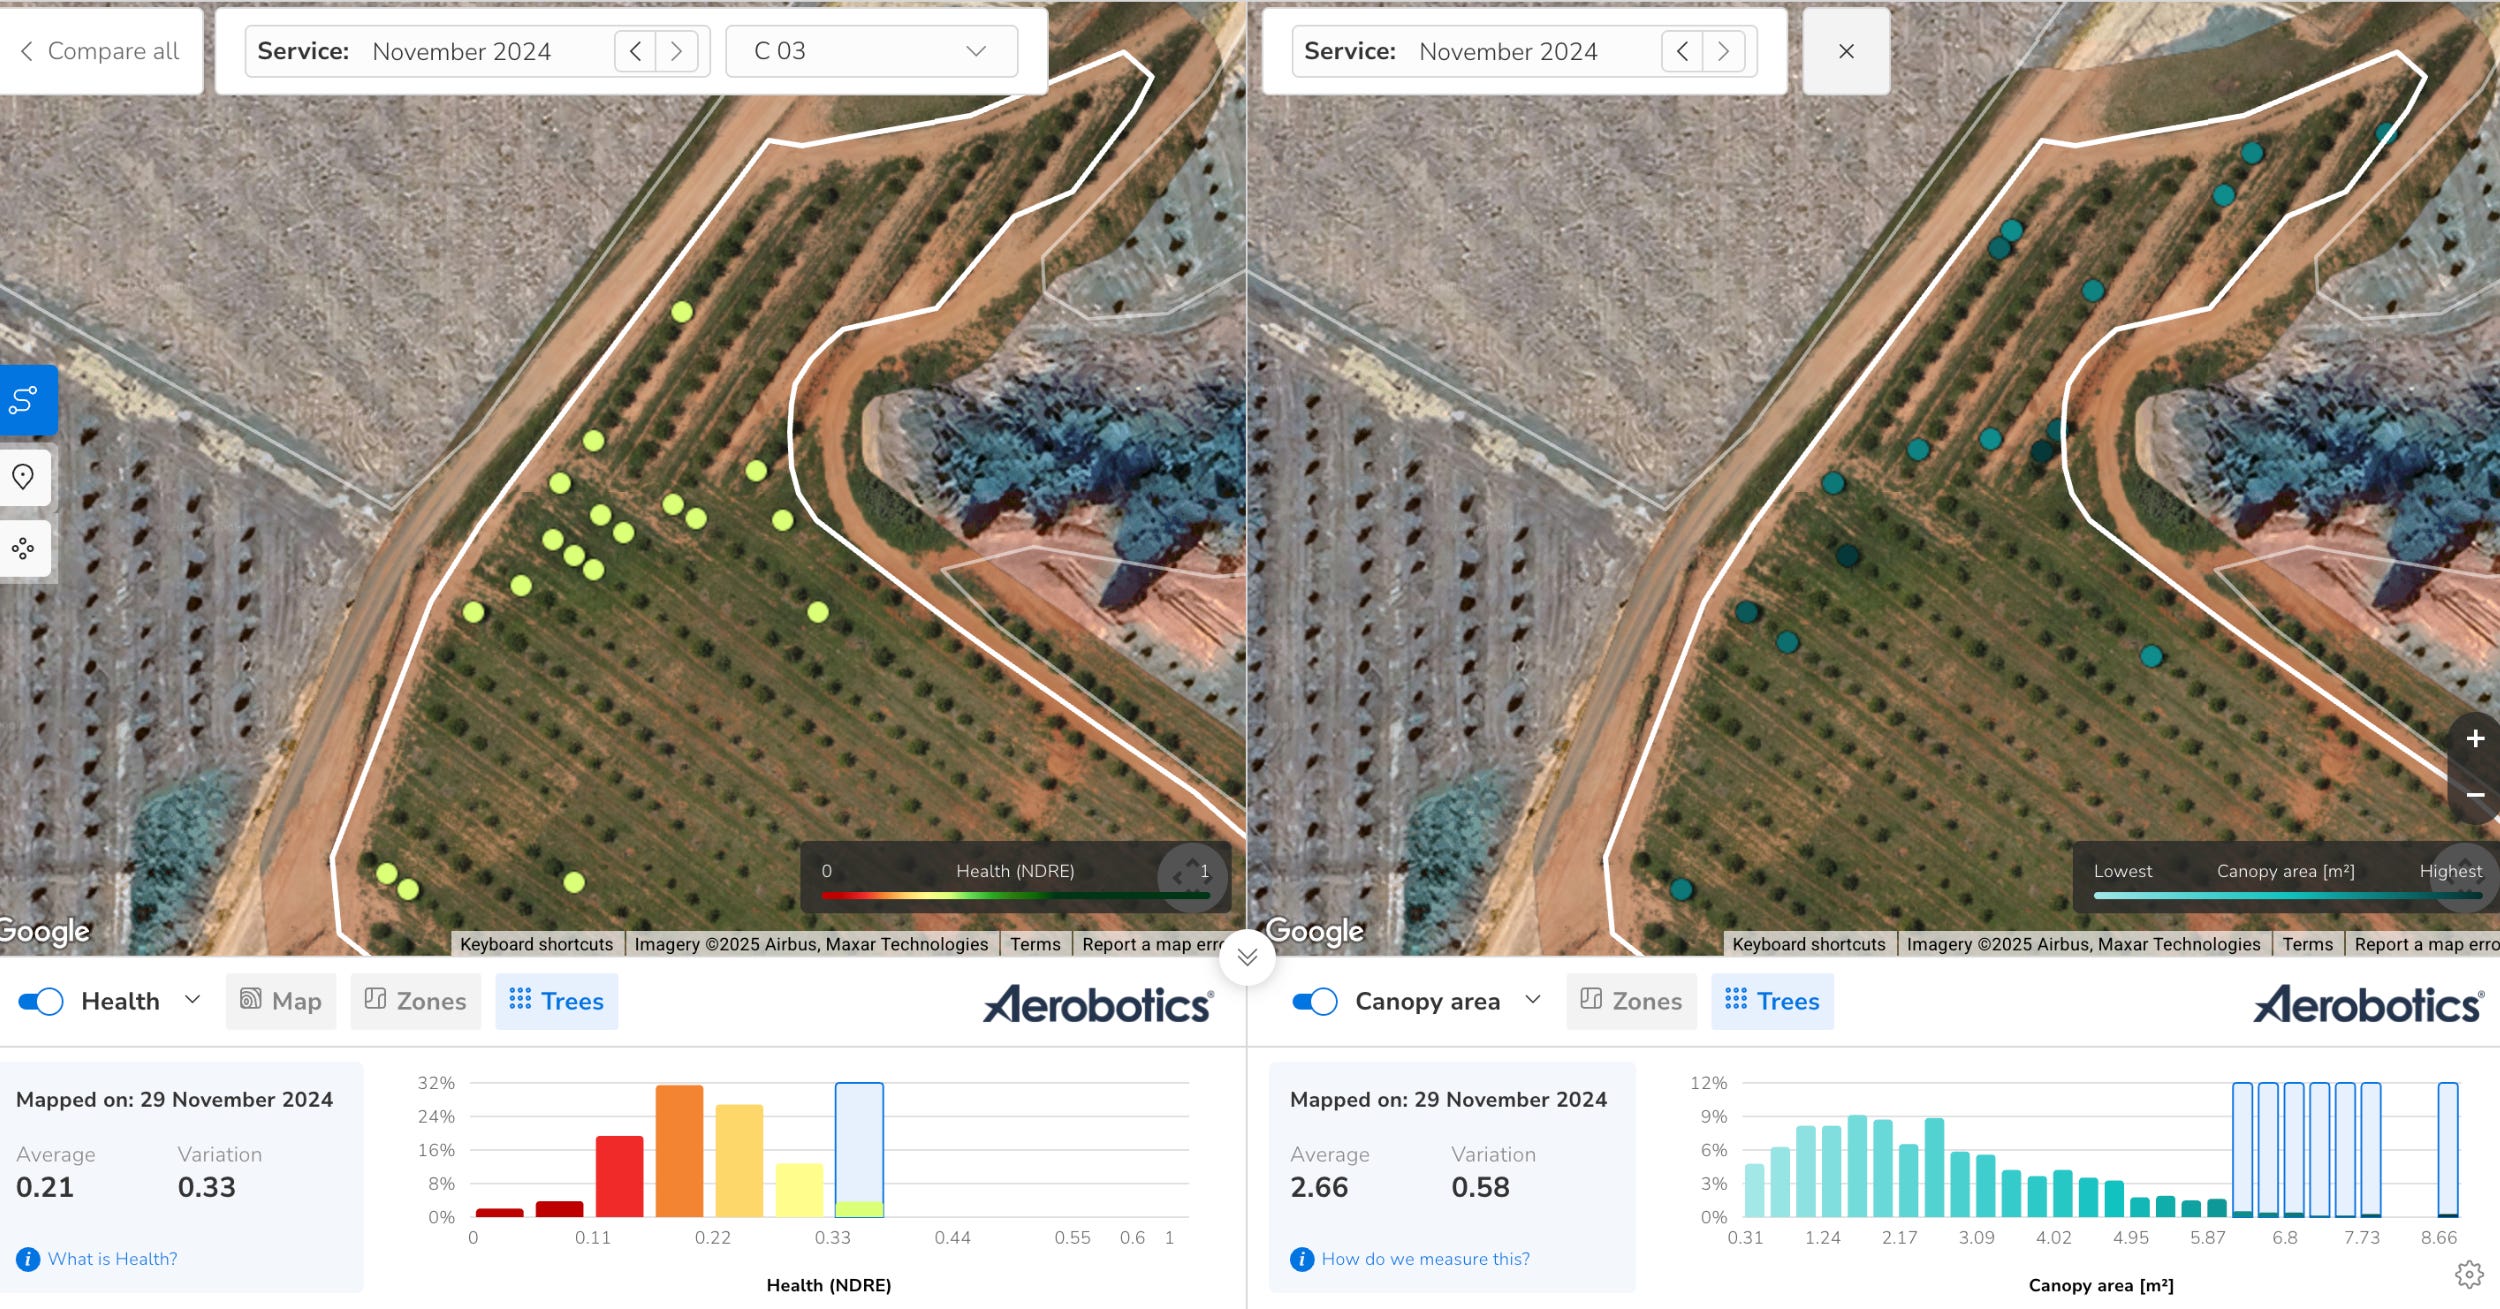
Platforms like Aerobotics let you visualise data per tree. Focus on the top and bottom 10–15% of the dataset when choosing sampling points. Alternatively, select outliers via the histogram bars for each drone data metric. These will highlight where these are quickly and easily.
2. Compare Outliers Within the Same Zone
Not all trees are equal. Sampling a weak tree on a slope and comparing it to a strong tree in a different soil type introduces noise. Keep comparisons within similar micro-zones for more meaningful results.
3. Pair Physical Sampling with Historical Data
Check the tree’s performance trend across previous seasons. Is it declining? Improving? Consistent? This adds vital context to what you’re seeing now.
Top Tip: In the image above, the “compare” feature was utilised to compare metrics, but the same tool can be used to compare the same metrics across drone survey dates.
4. Prioritise Repeat Visits
If a high-performing outlier remains consistent across seasons, it might reveal what success looks like under your specific conditions. Revisit, Review, and Revise any interventions if need be.
5. Use AI-Flagged Outliers for Efficiency
AI tools are increasingly good at identifying statistically significant outliers. Use platforms that flag abnormal values across multiple layers - NDVI, canopy, thermal - to speed up your scouting.
A Smarter Way to Sample
Outlier-focused sampling makes business sense.
You avoid blanket applications and expensive over-sampling, and instead direct your attention to the trees that deviate from the norm — for better or worse.
It also benefits the environment (an overlooked upside) by targeting interventions based on real variability. In this way we’re able to reduce chemical inputs, conserve resources (like fuel, time, labour), and respond with precision to in-orchard needs.
It’s a simple shift in thinking — but one that makes per-tree data feel truly actionable.
Instances like in the example above, saves time and resources.
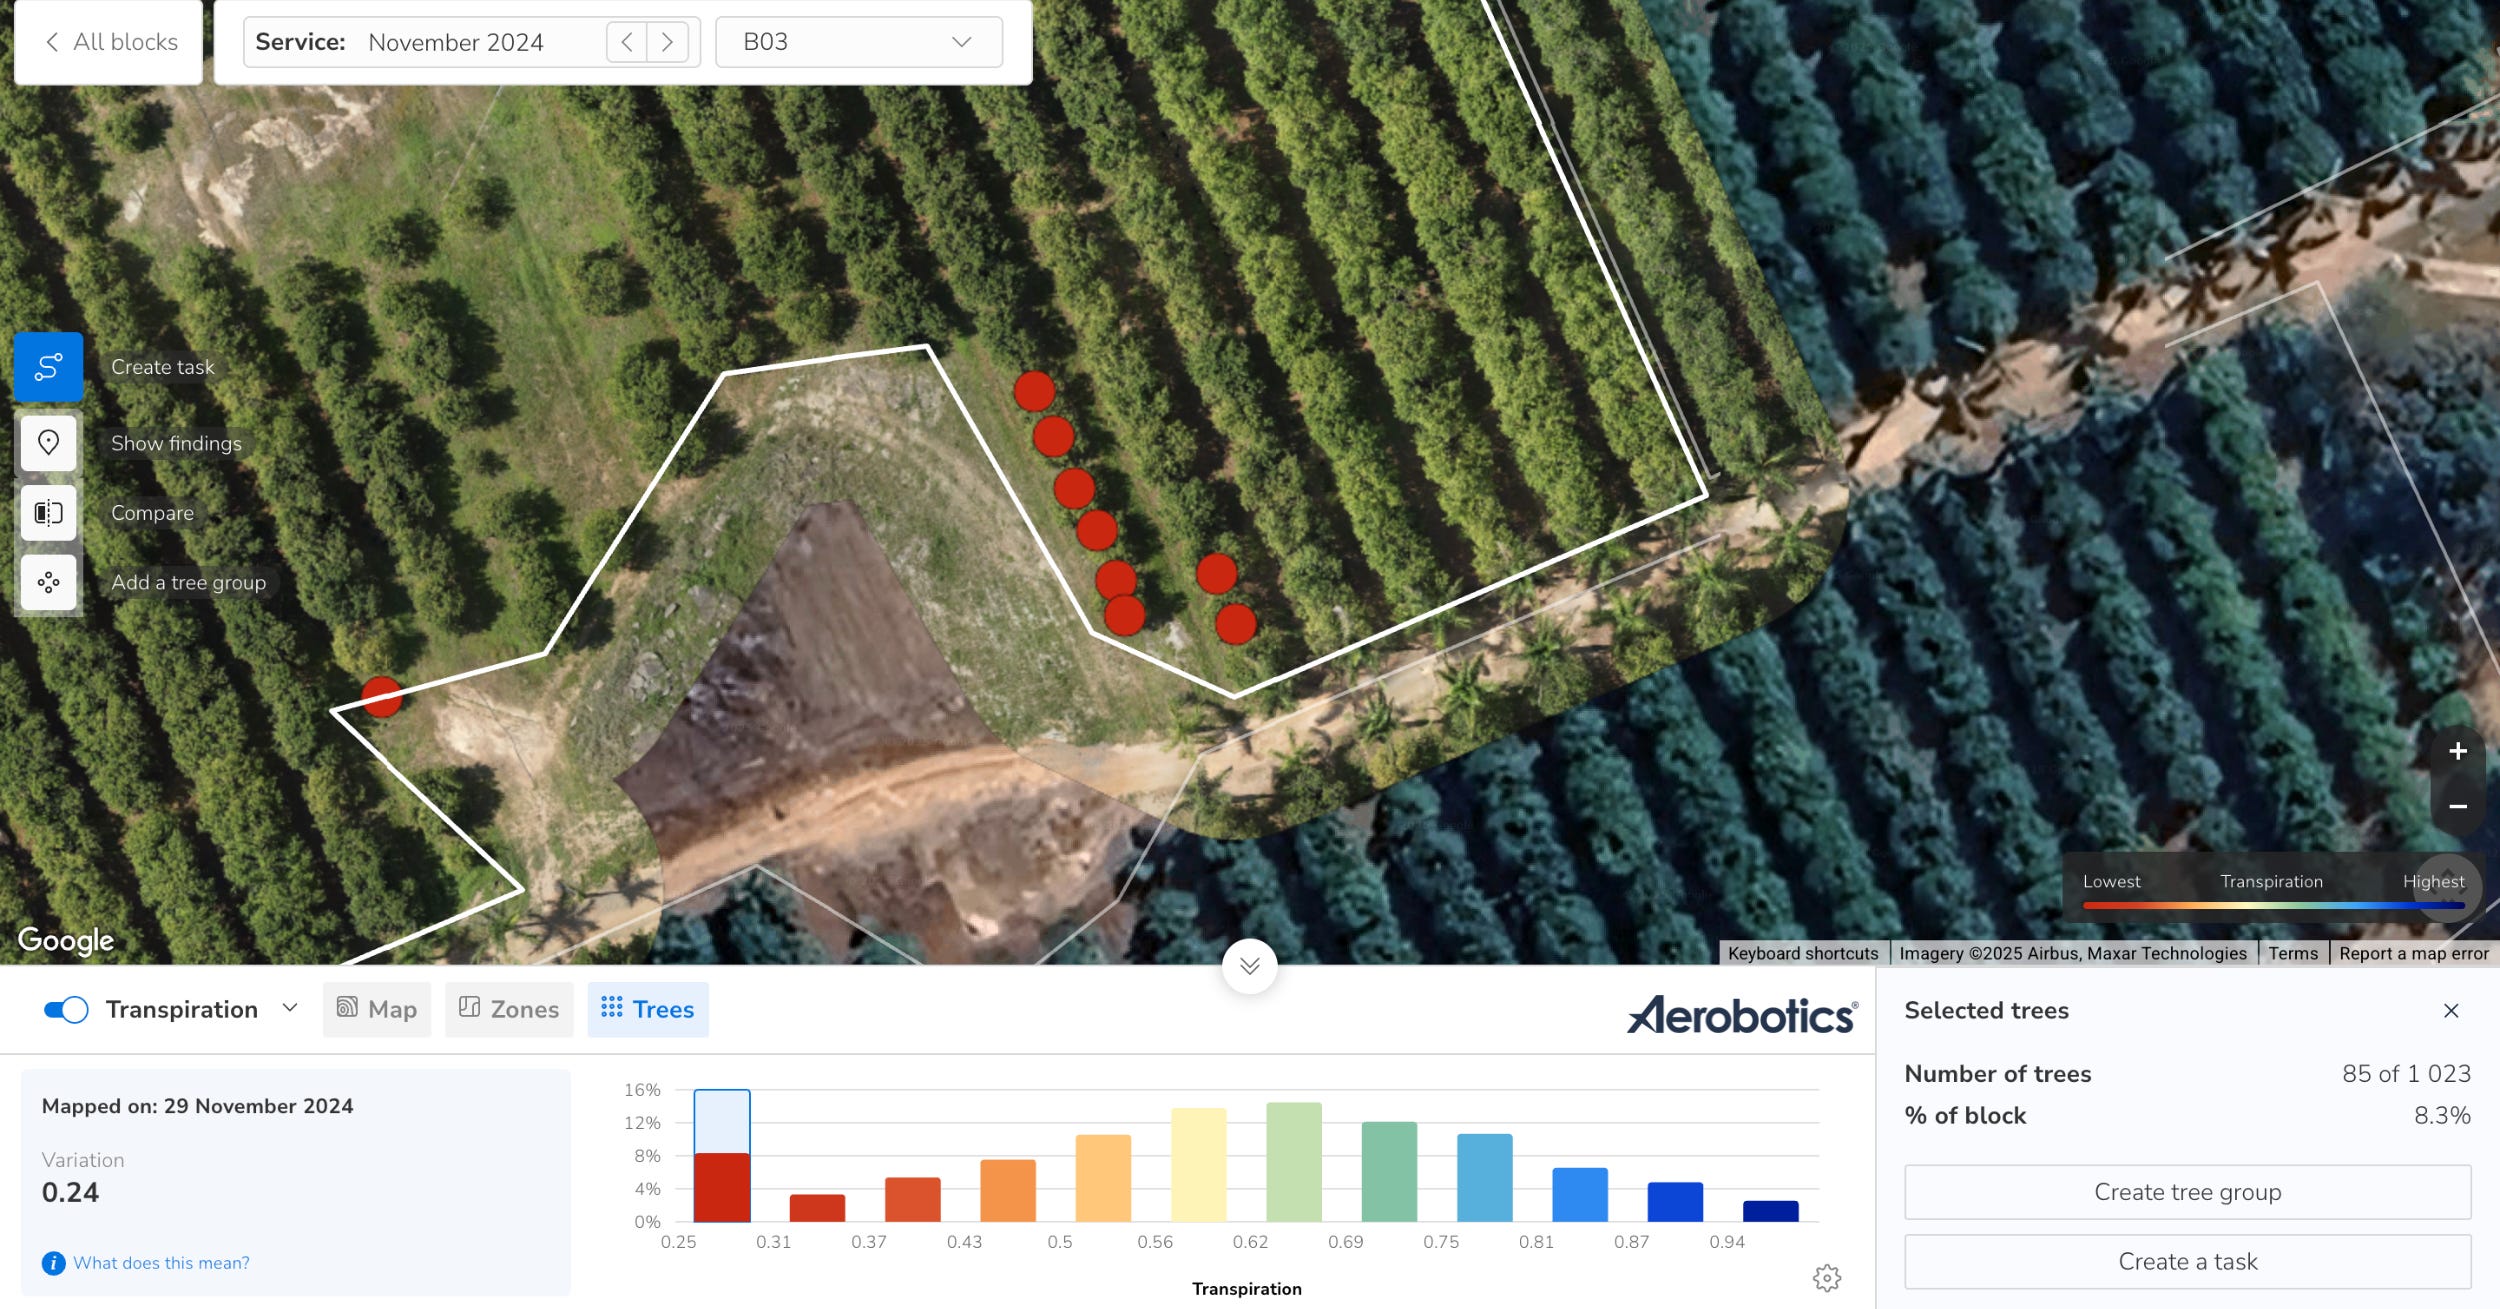
Data can help us to pin-points areas of concern, and quantifies the number of trees affected. In this case 8 of 85 low Transpiration Uniformity (TU) trees are in a line. An early detection of irrigation related issues.
Subsequently, an in-field task can be setup to visit this area, and findings (or actions) are recorded in the mobile app.
In summary, if you’re using drone data and not yet taking advantage of outliers in your sampling strategies, you’re leaving valuable insights (and potential profits) on the table.
The real value isn’t in the average; it’s in the exceptions that challenge your assumptions and reveal what you might otherwise overlook.
These trees aren’t just statistical noise — they are early warning signs and your untapped values.
Start today. Walk those trees. Take those samples.
Because the sooner we learn what makes them different, the sooner we’ll know what our orchard really needs.
The thinking starts here, but the real change starts when you take action.


