


Jaco farms macadamias in South Africa. He’d always scouted by eye, his team too, and they’re good at it. But trees on one side of the farm weren’t pushing the new growth the others were, and Jaco couldn’t figure out why.
A faulty irrigation valve had been starving one of his three blocks of water and nutrients. Nobody had noticed.
The drone survey showed it clearly: one block lagging the other two. A walk to the trees in the weak block and a comparison to the healthy blocks confirmed it.
His team fixed the valve, and the trees recovered.
“Without the detailed map, and a comparative view,” he said, “I would only have noticed when it was much too late - we’re about to head into the hottest time of the season!”
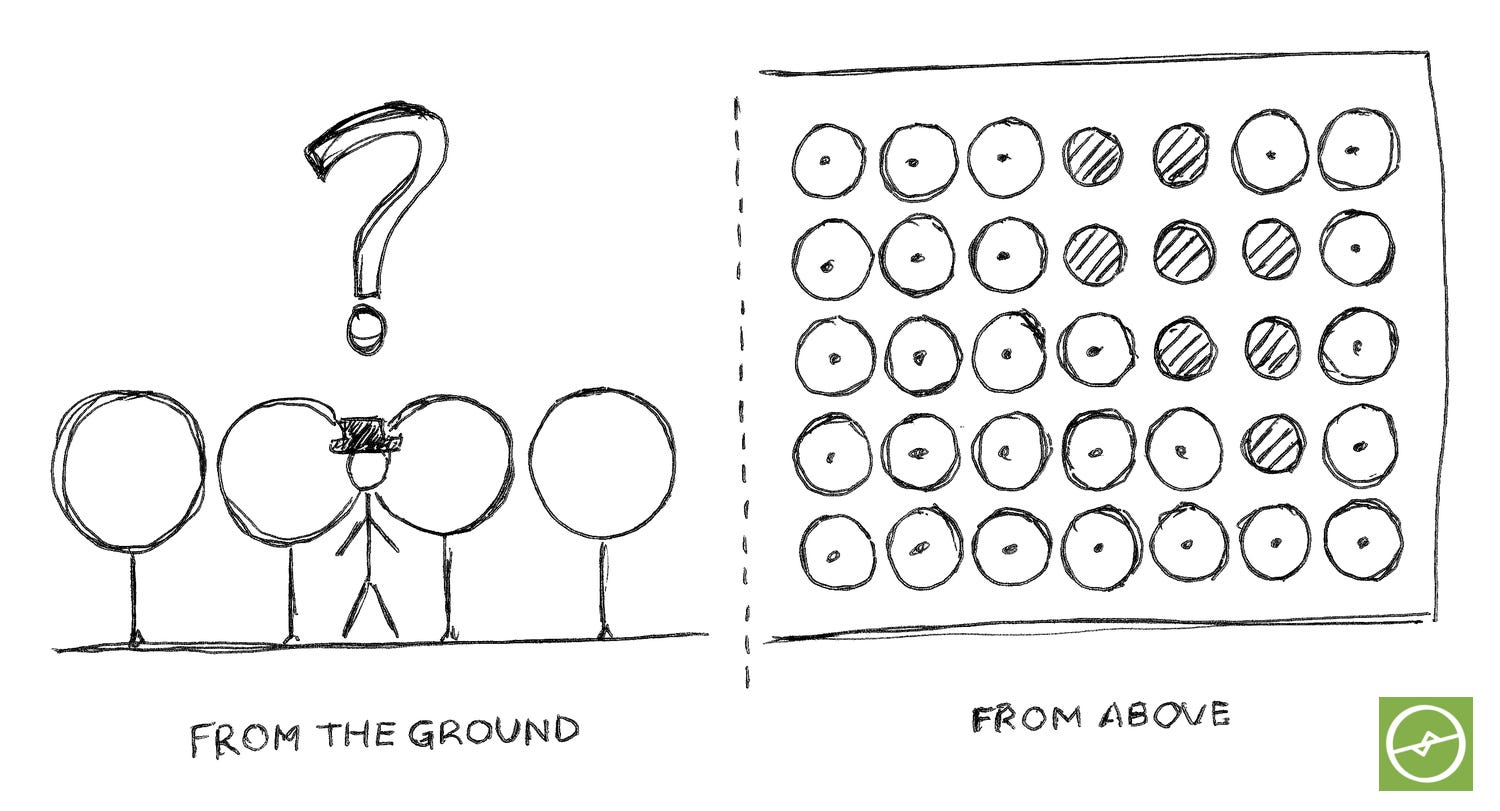
I’ve spent 7+ years working with farmers and production teams on their drone data, and Jaco’s story is unfortunately one of the exceptions. Most farmers glance at the data results and never log-in to their drone data platform again!
Some hand the maps to a junior to look over. Others tell their agronomist the drone maps are there “if you want to take a look”. Meanwhile the scouting team walks the same rows as last month, in the same way as always, and the same issues are missed.
Collecting the data is the easy part.
Reading it and taking action is where most farming operations get stuck.
A drone survey is a health scan of your orchard. A doctor doesn’t stop at the X-ray. They read it, check the patient again, diagnose, then treat. Most farmers get their “X-ray” of their orchards, but nobody sits down and reads it with them.
So, when I go through drone scan results, I ask three questions, in this order.
Where is the problem? The maps show which trees are falling behind.
Why is it happening? A targeted check in the field confirms the cause.
What do I do next? Irrigation, nutrition, sampling, replanting, the budget.
Jaco’s map answered the first in one flight. His walk to the trees answered the second. The third was his decision, and that’s where the ROI came in.
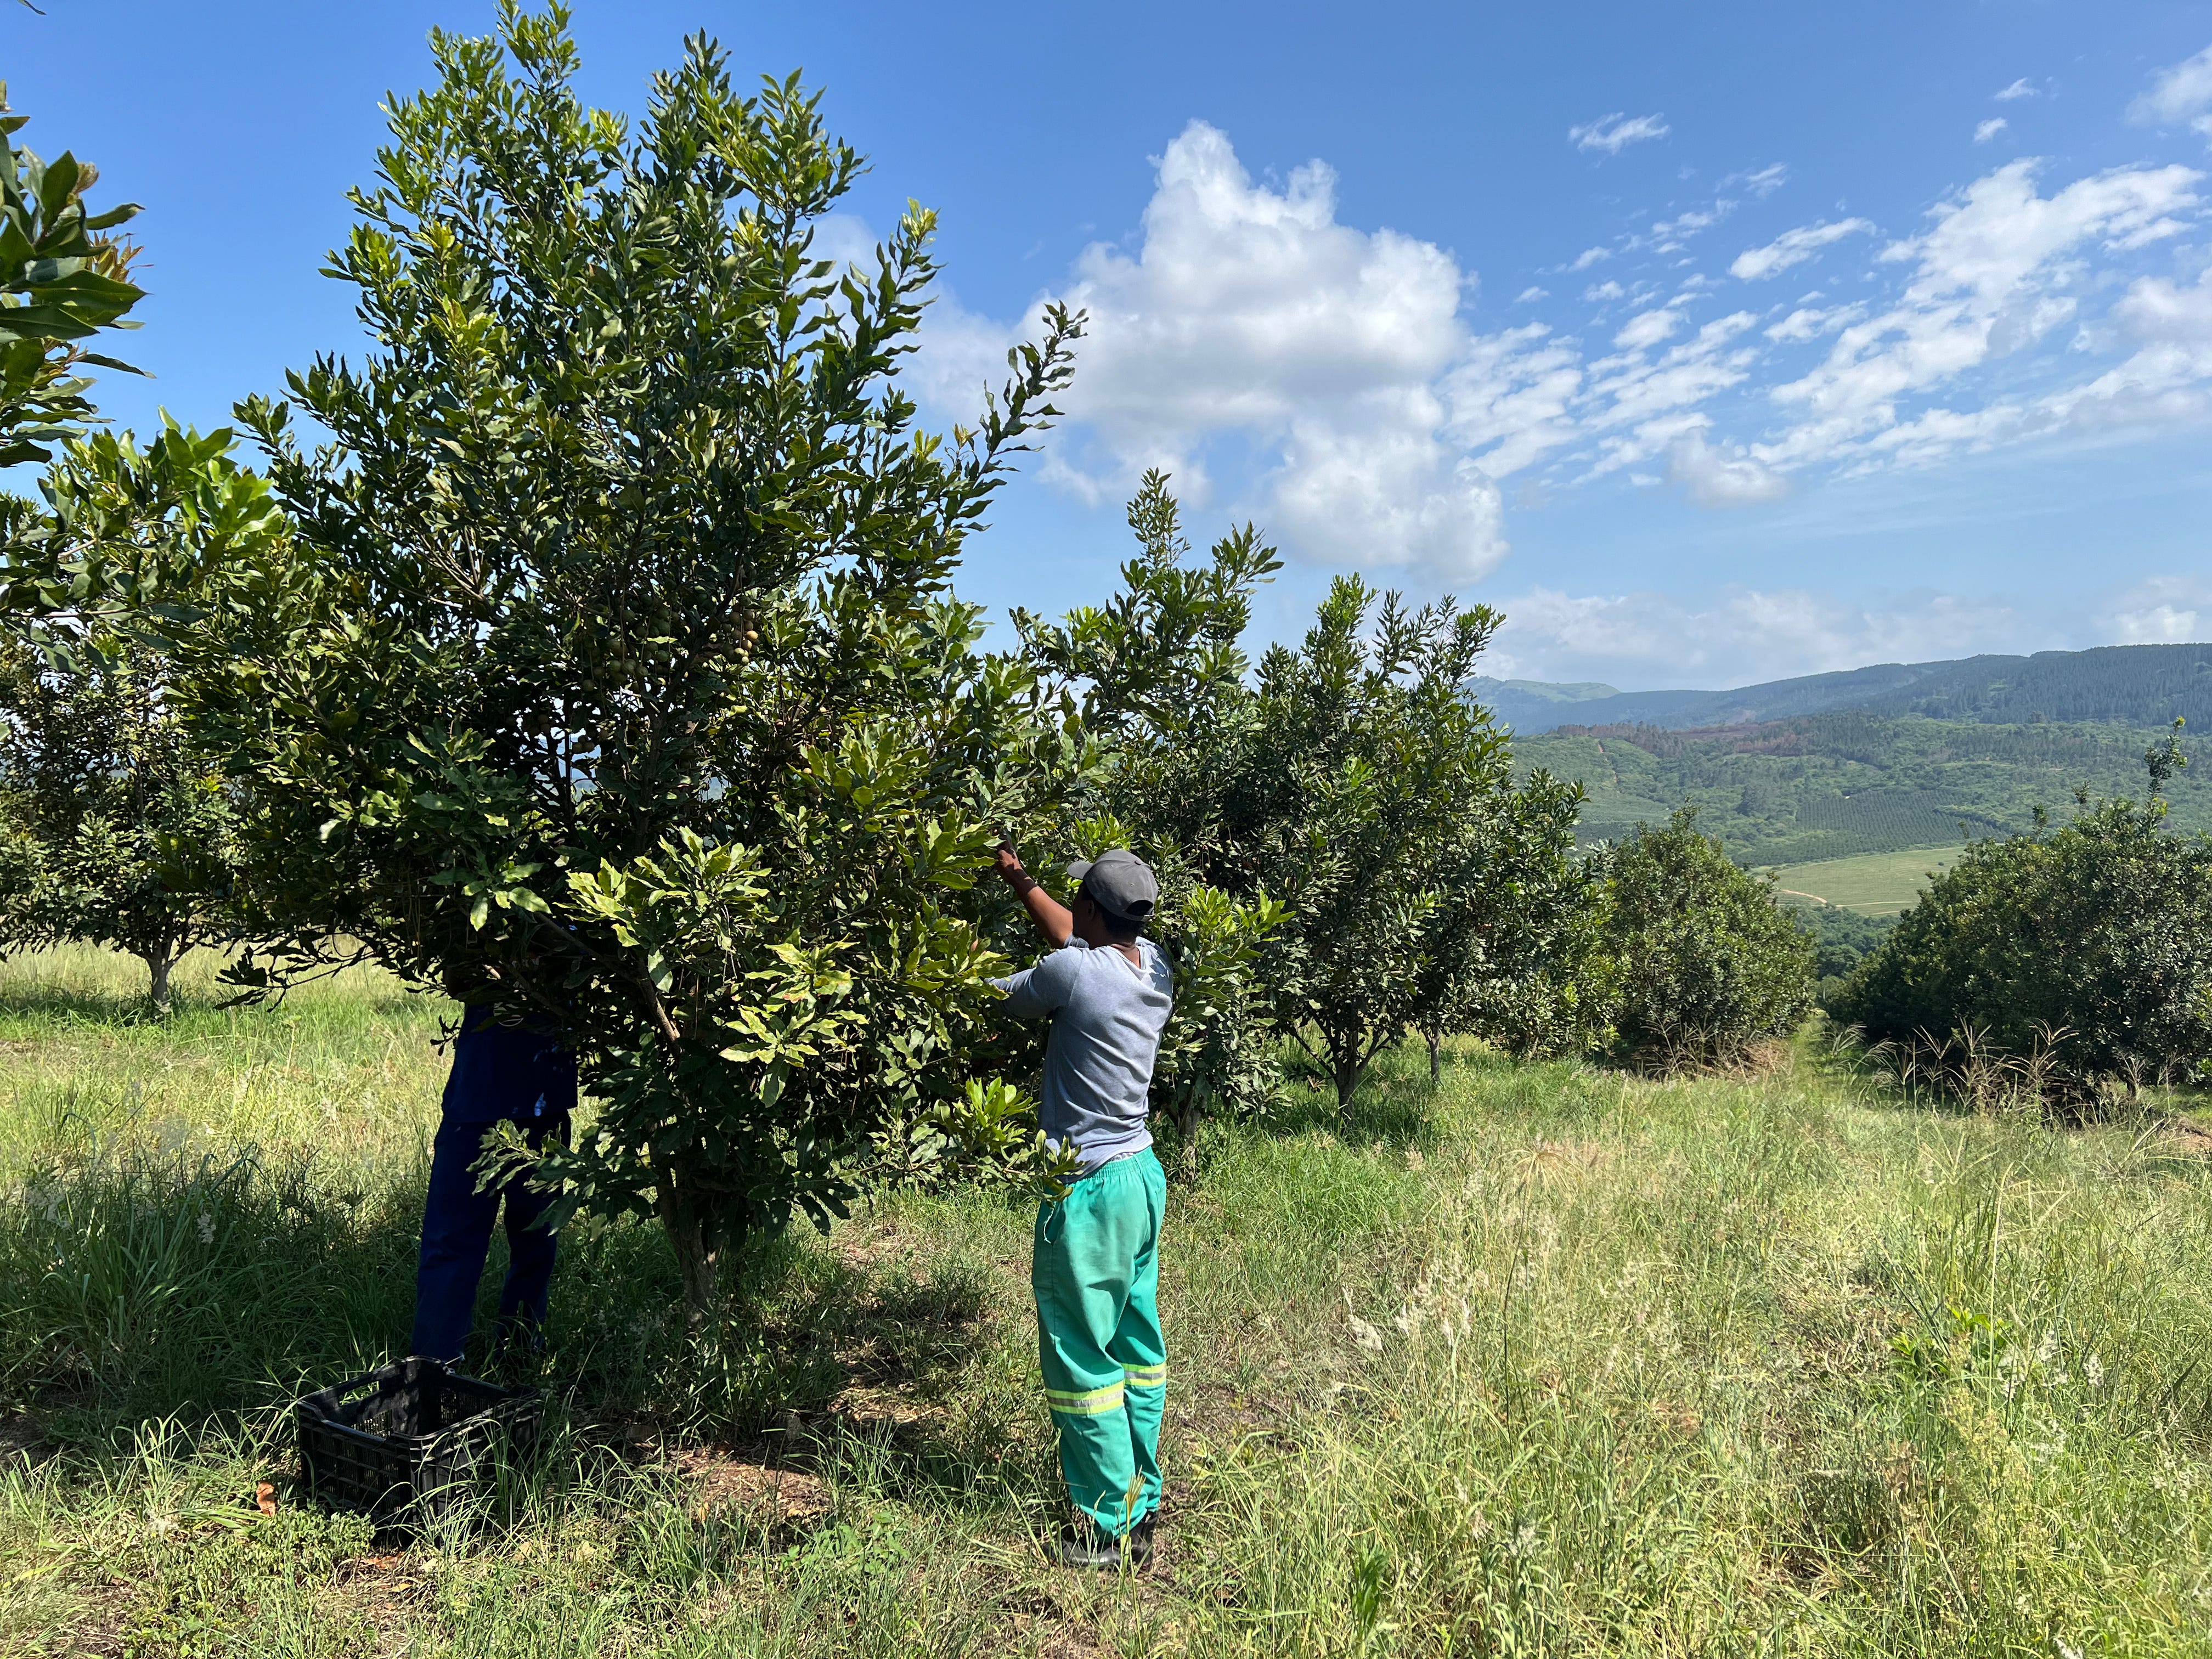
Try it this week.
Open your most recent drone survey and find the one patch that looks different from the rest. Before anyone touches the irrigation or the fertiliser, walk to three trees in that patch and three in a healthy patch nearby, and compare your notes. That’s question two of the three steps, and it usually takes less time than you think.
Some of you will be thinking “I’m not technical” or “my farm is different”.
Fair enough.
Tomorrow I’ll take you to a farm whose records said every block was 98% planted. The drone count told a different story, and it explained years of missed forecasts.
Edition 2 of Drone Data Metrics for Orchard Farming opens on Wednesday 25 November at 07:00 (South Africa time).
Reply to this email or leave a comment with one answer:
The last time you had a drone map of your farm…
was it acted on, glanced at, or passed on?
The thinking starts here, but the real change starts when we take action.
Ken
PS: This series was meant to start on Monday 16 November. Finishing the Edition 2 book took every spare hour, so this post is about a week late. The next two pieces follow on Monday and Tuesday - thanks for reading!