

Zonal Sampling with Drone Data: Targeting Orchard Variability with Precision
Use drone-derived NDVI, canopy, and thermal data to define orchard zones and sample smarter. Zonal sampling helps pinpoint where to act and what to fix – faster.


Zonal sampling is one of the most effective ways to turn drone-derived insights into targeted, in-field action. Instead of treating your orchard as a single unit or inspecting trees at random, this method identifies distinct zones of variability – each with its own performance profile and sampling approach.
It’s a strategy that’s been reshaped by technology. Thanks to drone imagery, per-tree metrics, and AI-powered tools, we can now inspect within orchard boundaries based on actual conditions, not guesswork or historical assumptions.
What Is Zonal Sampling?
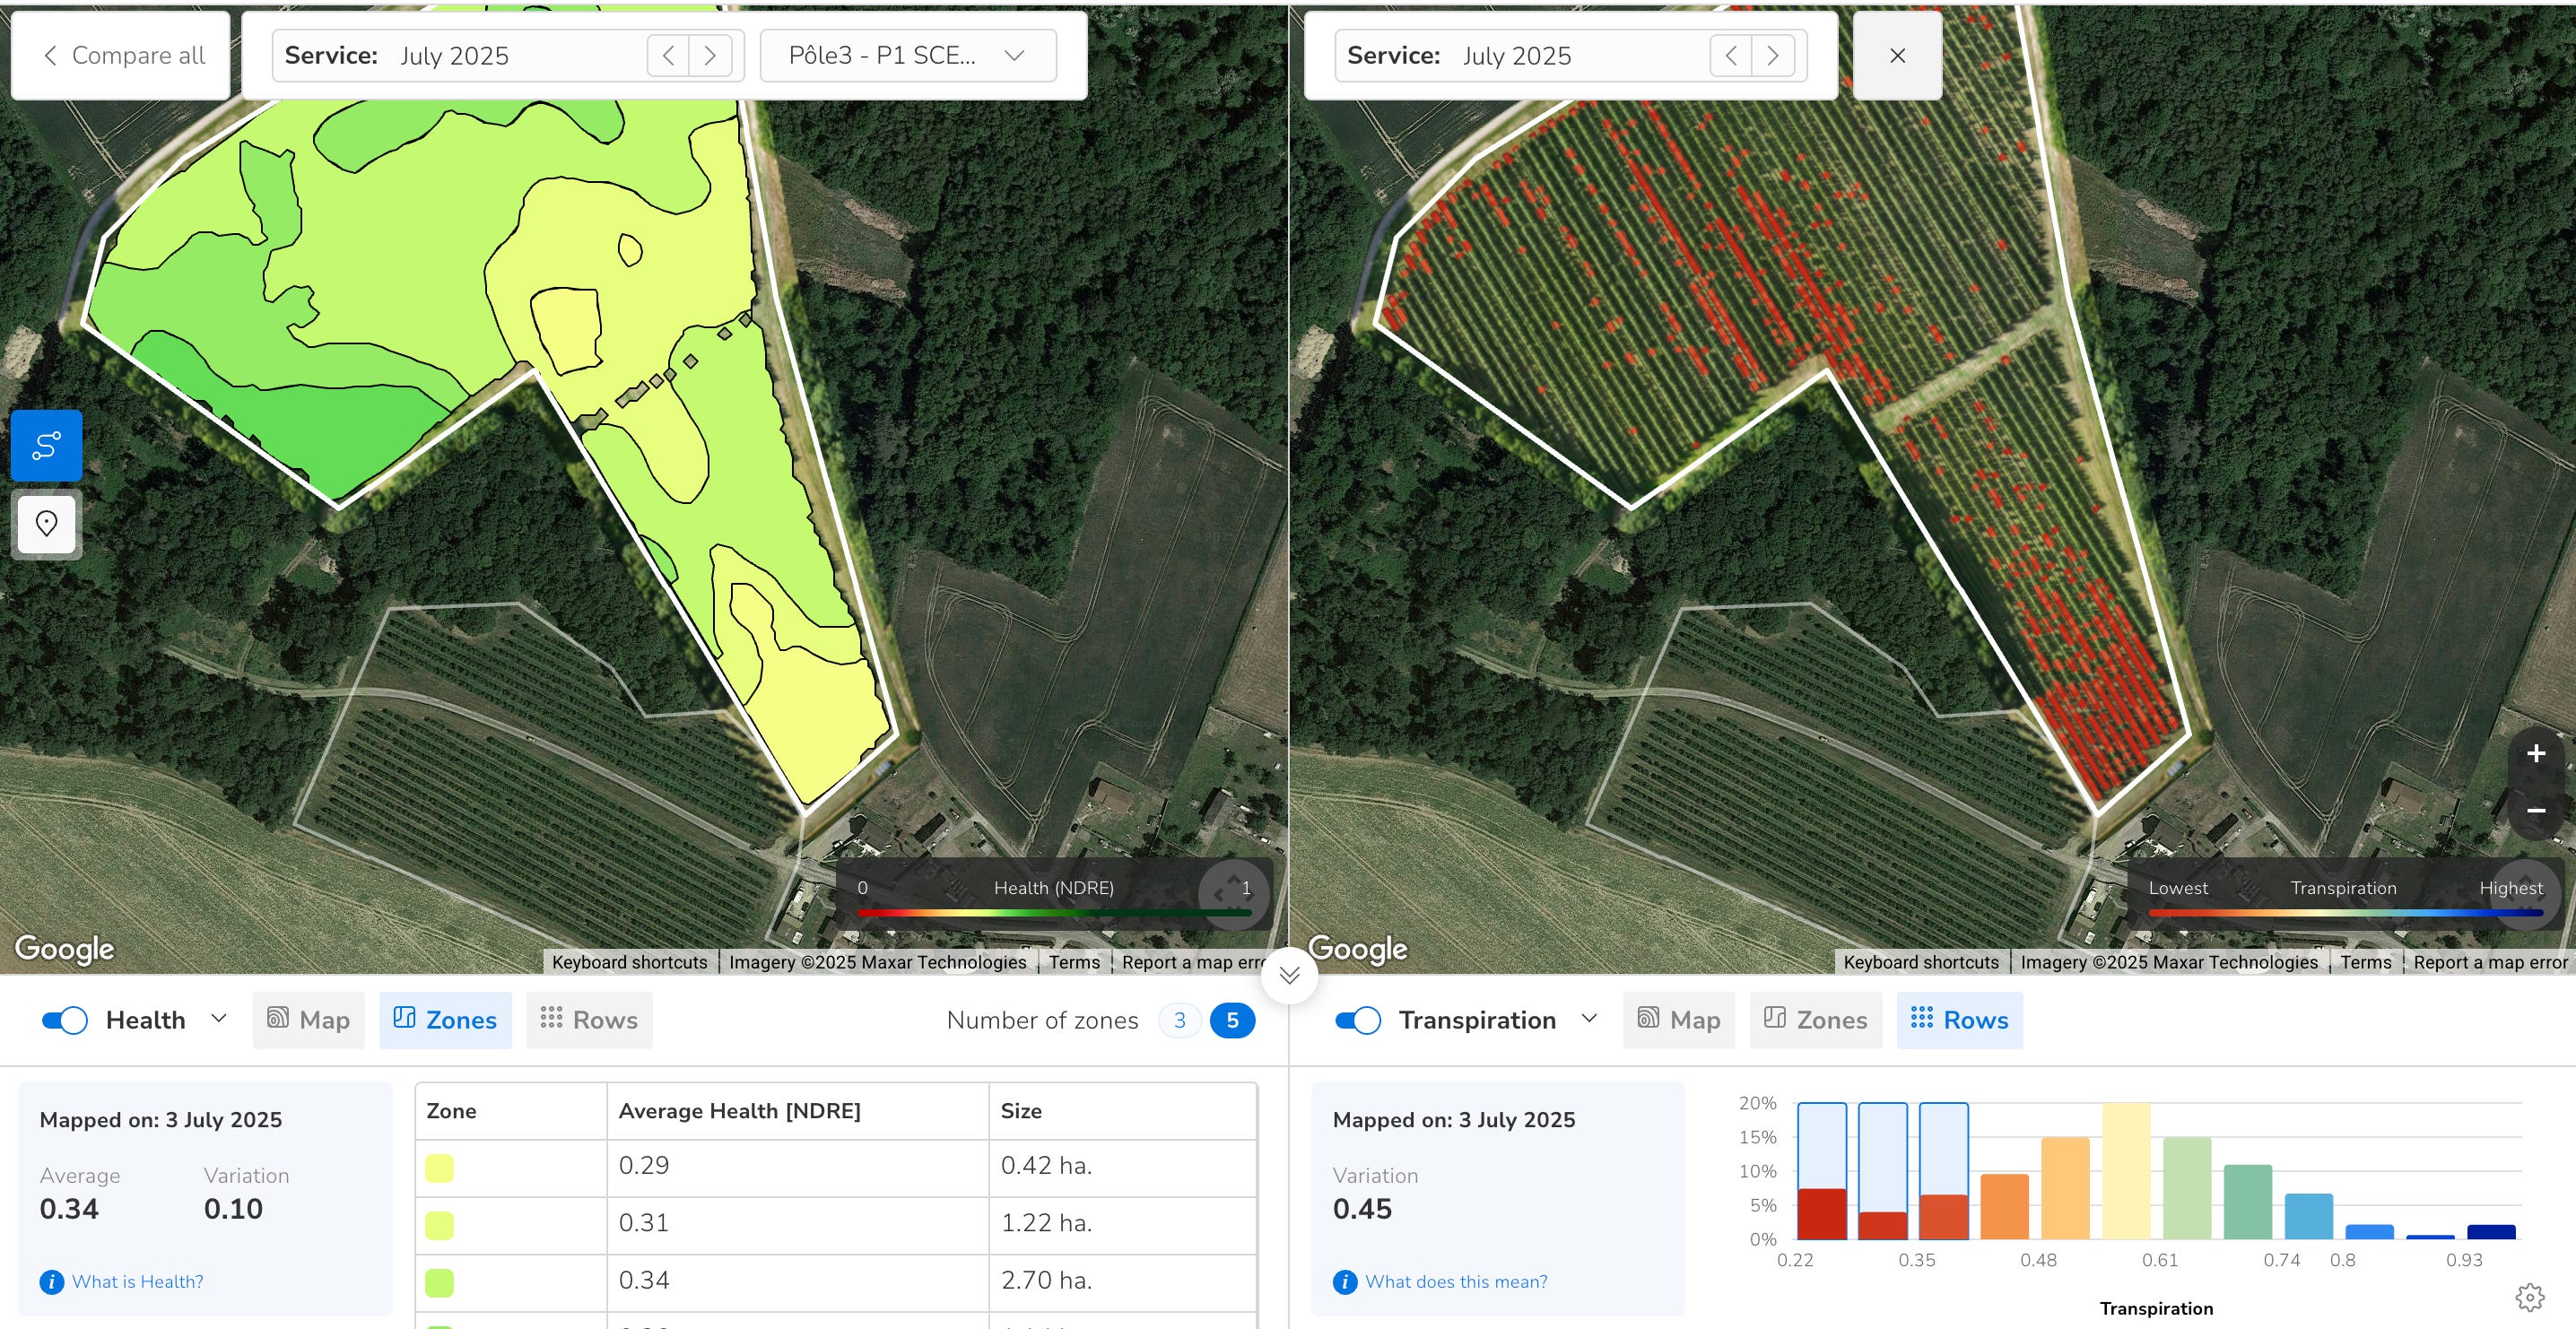
Zonal sampling divides a block into performance-based areas, typically using NDVI or NDRE, canopy size, elevation, or thermal data.
Each zone reflects a shared characteristic or stress pattern, and sampling a few representative trees from each zone provides a clear picture of what’s happening across the orchard.
Examples of zonal representations include:
A low-lying area prone to waterlogging displaying reduced transpiration (thermal + elevation data)
A high-performing section (vegetatively) with dense canopy and high NDVI
A weak zone along a fence line due to wind exposure or nutrient runoff
A low area where irrigation lines need flushing, or a higher area where trees are not receiving water due to pressure concerns.
These instances (and many more) can picked up with drone data and displayed as zones of concern. By comparing results from different zones, we can determine whether the issue is environmental, varietal, pest-related, infrastructure-driven, or something else completely.
How Zonal Sampling Works
Data Collection
Use drone surveys to capture NDVI, RGB, canopy volume, and thermal layers. Platforms like Aerobotics auto-generate these layers and allow historical comparisons over time.Zone Definition
Generate zonal heatmaps based on the metric of interest. Look for areas of consistent deviation (e.g. a persistent low NDVI patch or heat zone).Select Trees to Sample
Sample a small set of trees in each zone – ideally those that best represent the zone's conditions. These trees act as biological sensors, giving you early insight into larger issues.Validate in the Field
Use ground truthing to inspect your sampling trees. What you see from the air is the start – not the end – of the story.
Zonal vs Cluster-Based Sampling
Both methods aim to reduce workload and increase accuracy – but they differ in scope and structure.
Zonal Sampling looks at spatial areas of the orchard. It’s useful when problems are tied to environmental conditions like irrigation, slope, or airflow.
Cluster-Based Sampling, covered here, focuses on grouping trees with similar data signatures across the orchard – even if those trees are far apart.
In practice, both methods often work best together, complementing each other across the season.
When Should You Use Zonal Sampling?
When scouting for macro-level issues (and their epicentres), soil sampling, pest pressure checks, disease prevalence, suspected compaction areas, for change in soil type validations, or inspections related to nutrient issues across varied terrain.
When your drone maps reveal clear geographic patterns of stress, vigour, or transpiration metrics.
When planning variable-rate applications or irrigation adjustments.
When establishing a baseline for new orchards or unfamiliar blocks.
It’s especially powerful when combined with Yield Risk Reports (YRRs) like those provided by an agronomist, for task tracking, and seasonal overlays – all available within platforms like Aerobotics.
Real-World Example
A citrus block in the Eastern Cape displayed three NDRE zones:
Green zone – high vigour and uniform canopy
Yellow zone – moderate stress indicators
Red zone – poor canopy, heat build-up, and stunted trees
Rather than sampling evenly across the orchard, the agronomist chose 2–3 representative trees per each zone mentioned above.
The result? Identification of a root disease issue in the red zone, leading to swift intervention – and a yield improvement the following season. Inspecting the other zones provided valuable comparative information used to judge relative severity.
Next Steps:
Learn the Metrics
To go deeper into how to read and utilise drone data and structure your own sampling plan, sign up for the Drone Data Metrics email course – a free 8-part series covering:
RGB vs NDVI vs NDRE and among other metrics.
Canopy and Digital Elevation Model insights
Cluster-based vs zonal sampling
Smart scouting, yield risk analysis, and more…
Drone Data Metrics (Free email course)

If you want to learn more about the core sets of drone data you can utilise for enhancing agricultural efficiencies, this free course is for you!
You Might Also Like:


