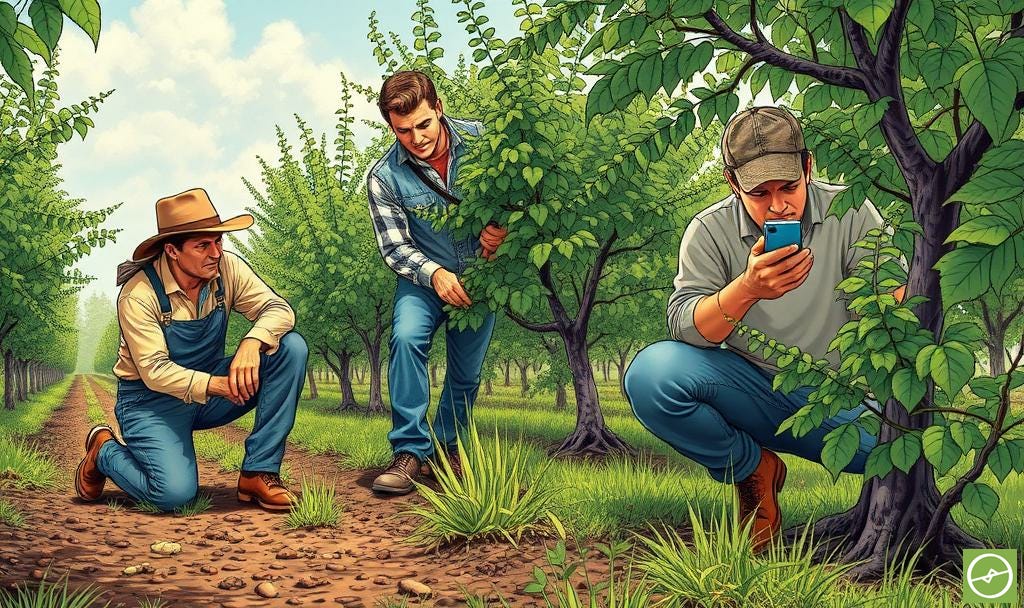
Per-tree Sampling methods: Cluster-Based Sampling
Using drone data to put effort where it counts. Read about how smarter grouping unlocks improved insights. Cluster-based sampling cuts out noise, saves time, and delivers sharper orchard insights.
In precision agriculture, not all trees need to be treated equally.
When we use drone-derived metrics to group trees with similar performance traits, we unlock a powerful method of cluster-based sampling.
This approach helps us reduce in-field effort while preserving the statistical strength of our observations.
It’s a smarter, more scalable way to monitor orchards – and an essential strategy for perennial crops like macadamias, citrus, or avocados, where both variability and volume can otherwise overwhelm sampling plans. This is especially true where labour capacity is restrained or a shortage of expertise are factors.
What Is Cluster-Based Sampling?
At its core, cluster-based sampling involves:
Grouping trees that exhibit similar characteristics (ie. low NDVI + low canopy size, or NDRE and low indicative vegetative volume) to guide you to areas of concern.
Sampling 1 or 2 trees from each group (“bunching up” on your sampling) to represent the whole, but keeping sample size manageable.
Reducing sampling load while maintaining insight accuracy across an orchard. Making sure sample size is relevant, while areas of non-concerned are ignored.
This approach differs from zonal sampling methods, whereby larger sections of the orchard are analysed collectively. Tree clustering operates at a granular level – offering a tree-by-tree lens within broader zones.
Which Metrics Matter?
Cluster-based methods rely on composite drone data layers to identify meaningful groupings:
NDVI or NDRE (indicating relative vegetative vigour and health)
Canopy Size or indicative Volume
Thermal Stress Layers (surface temperature readings)
Elevation / Gradient Data (tree health by slope or drainage pattern)
These metrics are often visualised via zonal representations, bar graphs, and histograms within tools like the Aerobotics platform – making it easier to spot patterns and select representative trees.
For example: A histogram showing a peak of low NDRE + low canopy trees in one section may indicate underperformance due to pest pressure, root issues, or poor drainage.
Sampling a few of these trees helps to validate the cause, and gauge prevalence levels.
Grouping Tools in Practice
With modern drone platforms, clustering is not only theoretical – it’s practical.
For example, the Aerobotics’ suite of tools allows:
Auto-grouping of trees based on similar metric profiles.
Zonal hotspot maps to flag radiating vs linear stress patterns.
Bar graph histograms where entire clusters (ie. all “red” trees) can be selected for sampling.
Visual comparisons like performance clusters relative to elevation or transpiration.
This enables sampling strategies such as:
Sampling 3-in-a-row per cluster to assess spatial consistency.
Sampling 2 trees on either side of an inter-row for increased sample size and added collection efficiency (only needing to move down one inter-row).
Cluster sampling up or downslope to check gradient-driven variability, for limiting factor identification.
These patterns reveal whether problems are localised (ie. irrigation nozzle failure) or systemic (ie. varietal underperformance on a specific rootstock, incompatible soil types, etc).
Why Cluster-Based Sampling Works
Efficient – You reduce total samples needed.
Targeted – You’re not guessing; you’re following the data.
Scalable – Suitable for large, multi-block orchards with diverse performance.
Repeatable – Year-on-year comparisons improve planning, track progress, gauge intervention effectiveness, and enhance decision-making.
All of these repeatable optimisations work together to improve on yield and crop quality, as well as build market resilience.
Cluster-based methods are an ideal middle-ground between sampling randomly and sampling every tree – giving you the insight you need without exhausting your team, or your budget.
Where to From Here?
If you’re new to per-tree metrics, or want to go deeper into how drone data enables smarter decisions… you will enjoy the Drone Data Metrics email course.
A free, 8-lesson primer tailored for tree and vine crop farmers, agronomists, agtech-curious producers, or drone pilots new to surveying agricultural land.
In the course, we cover in detail:
RGB, Multispectral, and thermal insights
Digitial Elevation Models and gradient layers
Smart sampling strategies
Tree-level canopy metrics
Workflow and tool selection …and everything in between.


