

Seeing Orchards from Above: Why RGB Drone Imagery Still Matters
Unlocking the hidden insights in everyday drone images . How RGB aerial data helps farmers spot problems, track change, and improve orchard performance.

When we think about drone data in agriculture, the conversation often jumps straight to the high-tech stuff. Multispectral sensors, thermal cameras, or AI-driven analytics.
But here’s the truth: the most common, most accessible, and often most overlooked data layer is still plain old RGB imagery.
And it’s far from boring.
If you know what you’re looking for, RGB can open your eyes to a whole new way of seeing your farm. Plus, this base data produces a complete set of powerful metrics you may not even know about.
Let’s dive in.
The Basics - But Not So Basic
RGB stands for Red, Green, Blue. The three primary colours of light our eyes can see.
Digital cameras use these channels to recreate every colour in the visible spectrum. Your smartphone camera, your DSLR, your drone - they all rely on RGB.
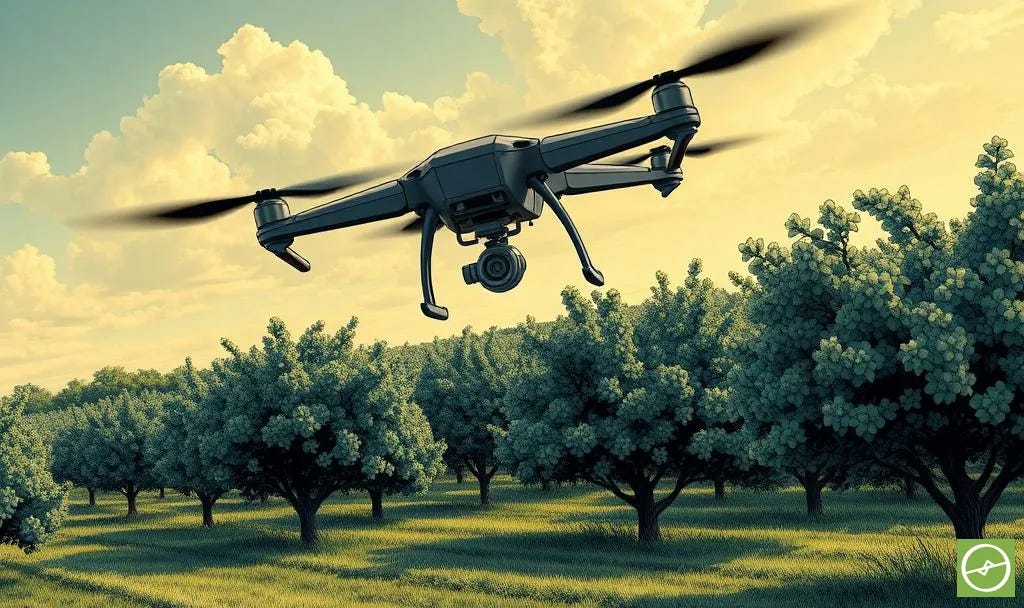
Most drones, from consumer-level to professional agricultural platforms, carry RGB cameras as standard.
These aren’t just for pretty pictures.
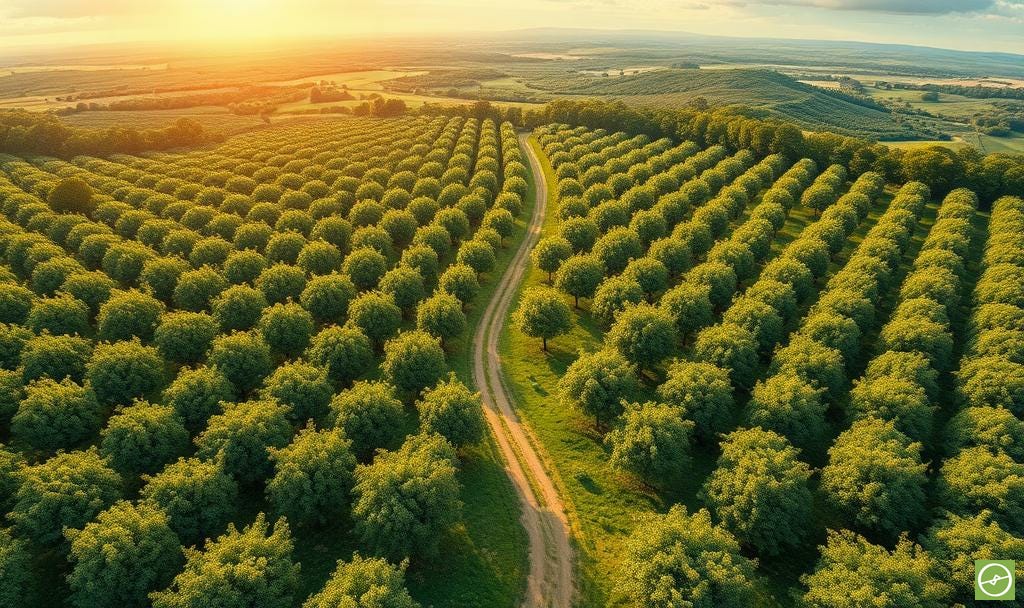
They are workhorses, capturing a visual record of your fields that, when viewed from above, reveals patterns impossible to spot from the ground.
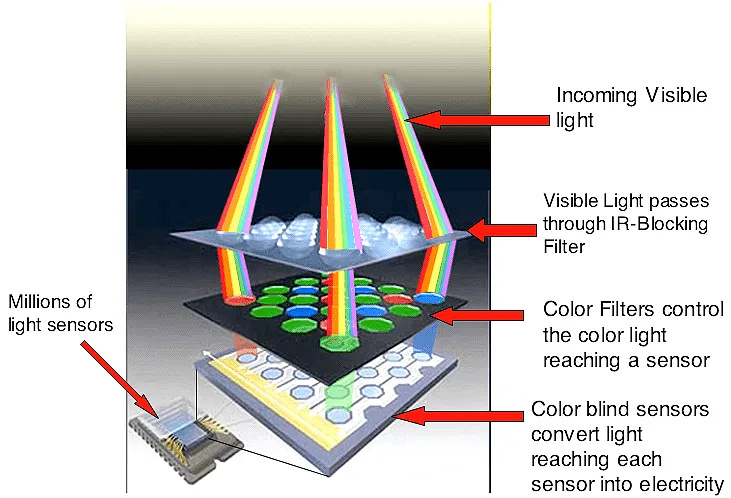
How Drones Turn Light into Insight
Camera sensors (CCD or CMOS) don’t naturally see colour.
They detect light intensity. A Bayer filter – a grid of red, green, and blue filters - sits over the sensor to capture colour information.
The camera’s processor then combines data from neighbouring pixels to create a full-colour image, a process called demosaicing.
The result is an image that looks natural to us… but the data can tell us far more than what our eyes can alone.
Why RGB Is Still a Farmer’s Friend
Because RGB imagery looks “normal”, many underestimate its power. But viewed from above, it can expose:
Subtle differences in canopy colour or density
Missing trees or poor establishment
Patterns of decline across an orchard block
Wind, waterlogging, or erosion damage
Large-scale pest or disease outbreaks
It’s the cheapest, fastest way to start spotting trouble before it becomes a crisis.
From Pictures to Decisions
Your eyes are good at spotting differences. But measuring them consistently across hundreds or thousands of trees? That’s where AI-powered image processing changes the game.
Modern agricultural analytics can now:
Count plants automatically
Detect missing or damaged trees
Measure canopy size and volume
Identify stressed vegetation
Compare changes across seasons
That’s the shift – RGB data stops being “interesting pictures” and becomes quantified intelligence you can act on.
Working With Other Data Layers
RGB really shines when paired with other data:
Multispectral confirms if visible differences relate to measurable plant stress.
Thermal links visual anomalies to water-use efficiency and irrigation performance.
Digital Elevation Models (DEMs) reveal how slope and drainage drive the patterns you see.
Quick Example: An orchard looks healthy on the RGB visuals. But a DEM overlay shows a low-lying corner holding water. Multispectral confirms chronic stress there. That’s targeted drainage work you wouldn’t have pinpointed otherwise.
Tracking Change Over Time
One of RGB’s biggest strengths is change tracking, where regular drone scans can help you:
Measure canopy growth after replanting
Monitor pruning or thinning results
See if drainage or irrigation upgrades are working
Detect problem areas before they spread
Because RGB is comparatively inexpensive to capture, it’s perfect for routine monitoring, and not only provides visual views from above, but with the right software platform will provide canopy metrics, DEMs, and more. Basically, you’ll get some of the most of the valuable metrics outside of multispectral info and thermal insights.
RGB Limitations
RGB isn’t perfect.
It can’t see beyond the visible spectrum, and lighting conditions can skew interpretation. Dense canopies can hide issues deeper down. That’s why it works best as part of a layered approach with other sensor types like multispectral, thermal, LiDAR, etc - depending on your needs.
The Bottom Line
RGB drone imagery is the simplest, yet one of the most versatile tools in aerial crop monitoring. In a nutshell it offers:
High-resolution, stable, colour-accurate imagery.
Orchard-wide patterns you’d never see from the ground.
A reliable foundation for integrating other datasets.
A cost-effective way to monitor change and guide action.
Far from “basic”, RGB remains an indispensable entry point into precision agriculture.
If you’re flying a drone, you’re already collecting it.
The next step is to start using it like the decision-making tool it really is.
The thinking starts here. The change starts with you.
PS: Learn more about drone-derived data metrics, including a deep-dive into RGB, and all the other valuable insights UAVs offer for orchard farming in the free course below:
Drone Data Metrics and Orchard Farming (the mini course)

If you want to learn more about the core sets of drone data you can utilise for enhancing agricultural efficiencies, this free course is for you!