

Terrain Truths: Using DEMs to Unlock Orchard Potential - Your FAQs Answered
Expert answers on how Digital Elevation Models improve drainage, reduce stress, and boost yield in orchards using drone‑derived terrain data.

After my recent post on using Digital Elevation Models (DEMs) to improve orchard planning and management, a number of readers reached out with excellent follow‑up questions.
Here’s a deep dive into those questions, and how DEM insights translate into better decisions, healthier orchards, and stronger returns.
If there are any more questions… I’ll see you in the comments!
1. How does “elevation blindness” affect decision‑making in orchard planning, and what are the long‑term economic implications?
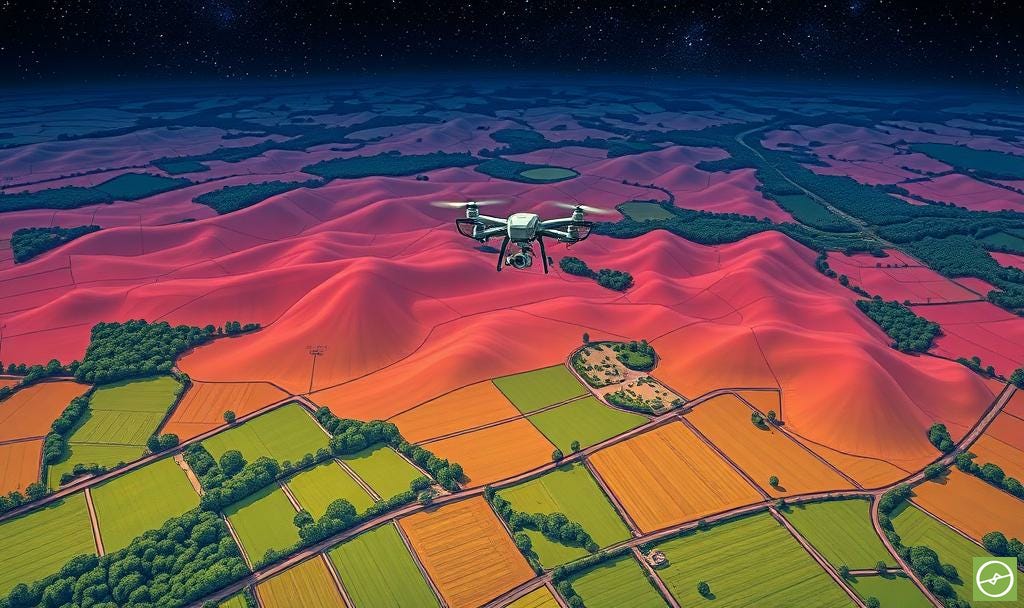
Ignoring elevation data means missing hidden drivers of poor performance further down the line, from water‑logging and erosion risks to subtle soil‑related constraints that quietly limit tree health, yield, and long‑term orchard profitability.
A. Establishing New Orchards on Uncultivated Land
When planning a new orchard, topography is only part of the equation. Ignoring either elevation or soil type can set the project up for decades of reduced productivity.
A DEM gives you the slope, drainage, and watershed patterns, but it does not tell you what’s in the ground. In‑field soil sampling and classification are essential to confirm soil depth, texture, and drainage potential in different terrain zones.
For example:
A gentle slope on the DEM may look ideal for planting, but field sampling could reveal shallow soils or a hardpan layer restricting root growth.
Low‑lying areas might drain acceptably in sandy soils but could hold water and cause root asphyxiation in heavier clays.
Subtle soil boundaries invisible in aerial data can influence root vigour, nutrient holding capacity, and susceptibility to compaction.
Combining DEM analysis with soil mapping allows for site‑specific block layout: selecting rootstocks, varieties, irrigation systems, and even tree spacing suited to each micro‑zone.
Skipping this step risks planting trees in unsuitable zones, leading to chronic underperformance and avoidable replant costs.
Here are some common terrain scan use cases:
Hig-res orthomosaics
Elevation mapping
Drainage modelling
3D Terrain modelling
Slope Modelling
“Good ecological planning sees the land - not just what grows on it.”
- Node Ecology.
When planning orchards (whether from scratch or in long‑standing blocks) terrain tells you how the water moves, but the soil tells you how the trees will live. Both must be read together to design for yield, longevity, and profitability.
B. Planning in Established Orchards
For mature orchards, elevation blindness can mask long‑term underperformance, but so can soil variability. Even in established blocks, soil surveys remain valuable - especially in conjunction with DEM data—because they help explain persistent problem zones.
For example:
Depressions visible on the DEM may consistently hold water, but soil sampling can reveal whether that’s due to clayey subsoil, compacted layers, or organic matter accumulation.
Erosion might thin topsoil in elevated zones, reducing nutrient availability and water‑holding capacity.
Historical replant failures in specific spots could be linked to a combination of poor drainage (seen in DEM) and unfavourable soil chemistry or structure (seen in sampling results).
Integrating DEM layers with soil classification maps creates a more complete picture of orchard health and resilience. This enables targeted remedial actions like subsoiling, installing drains, applying organic matter, or altering irrigation scheduling to suit actual site conditions.
2. In what ways might using a DSM instead of a DTM lead to flawed interpretations in orchard terrain analysis?
A Digital Surface Model (DSM) includes tree canopies and structures.
Useful for certain planning tasks, but it obscures the true ground surface.
For terrain‑related management (drainage, erosion, irrigation flow), the canopy height in a DSM can create false “high spots” and “low spots,” misleading decisions.
A Digital Terrain Model (DTM) is essentially a “bare earth” DEM; which strips away vegetation to give accurate slope and elevation readings. DTMs frequently utilise LiDAR data, so if an unobscured view of the terrain surface is what you are looking for, aim for using a LiDAR scan.
3. How can DEMs be integrated into smallholder or resource‑limited orchard systems without heavy investment in technology?
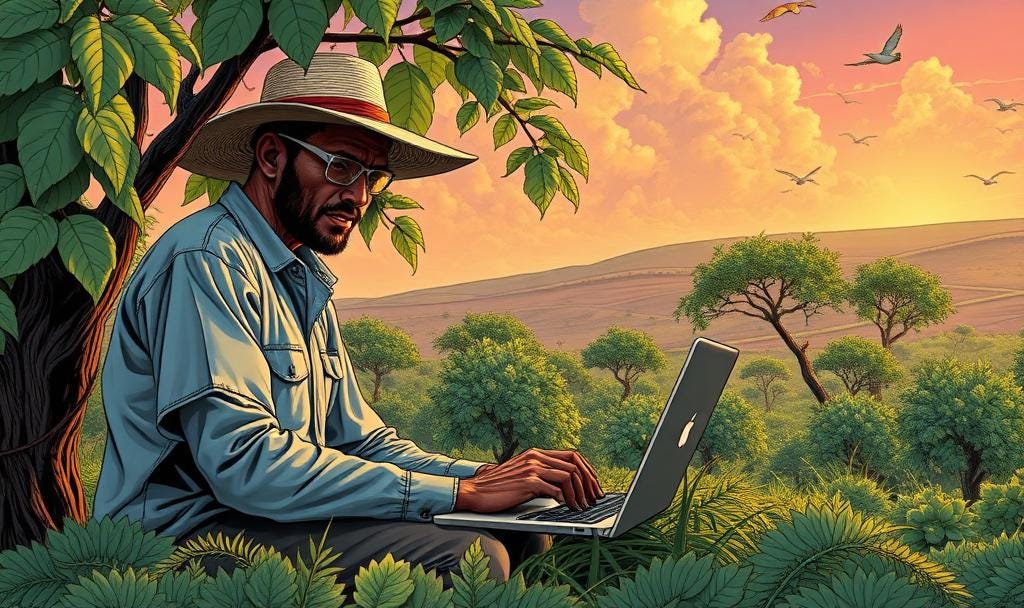
While high‑resolution drone mapping can seem out of reach for smaller or resource‑limited operations, the reality is that DEM insights can still be brought into your planning without heavy capital investment.
The key is to think strategically about access rather than ownership.
You don’t need to run weekly drone flights to gain value; even an initial, well‑timed DEM survey can reveal drainage risks, highlight problem slopes, and guide infrastructure placement.
By pairing that elevation data with on‑the‑ground knowledge, on-the-ground soil observations (and basic mapping tools) smallholder farmers can prioritise the interventions that deliver the greatest return for the least cost.
Just as important as knowing the slope of your land is understanding what lies beneath it. DEMs can show where water will move and pool, but only soil sampling will confirm whether those areas can handle the moisture or are prone to water-logging, compaction, or nutrient leaching.
By combining elevation mapping with soil type verification, even a single well‑planned survey can give smallholders the confidence to adapt planting layouts, choose suitable rootstocks, and design irrigation systems that work with (not against) the natural character of the site.
Some quick ideas that might help:
Partner with local drone service providers for periodic surveys rather than buying your own drone.
Use free or low‑cost GIS viewers (ie. Aerobotics, or QGIS) to explore basic slope and contour maps, with nominal data processing fees - if any.
Combine DEM data with simple field observations to focus limited resources on the most critical areas.
Join co‑operative cost‑sharing programmes for annual surveys. Especially effective in high‑value crops, or where full-farm orchards hectares are below usual data-collection Minimum Order Quantities (MOQs).
As little as one good DEM can guide major improvements, and provide a base for extensive analysis or operational enhancements.
And as always, with AgTech solution connected to the cloud (for viewing data, and collaborating with consultants and/or team members) a stable internet connection will go a long way! I’m only mentioning this, as experience tells me that many smallholder operations are often found in hard-to-reach places, where internet coverage can be patchy.
4. What are the strengths and weaknesses of SfM photogrammetry vs LiDAR in generating DEMs for orchards?
To clarify for readers who are not familiar, Digital Elevation Models (DEMs) can be generated from RGB images using Structure-from-Motion (SfM) photogrammetry. SfM is a technique that uses overlapping RGB images to reconstruct a 3D model of a scene, which can then be processed into a DEM.
Choosing between Structure‑from‑Motion (SfM) photogrammetry and LiDAR isn’t just a technical decision - it’s about matching the tool to your orchard’s unique conditions and your operational goals.
Both methods can produce high‑quality Digital Elevation Models, but they do so in very different ways, each with its own cost, accuracy, and practicality considerations. Factors such as canopy density, row spacing, budget, and the level of detail you need will guide the choice.
Understanding where each technology excels (and where it falls short) helps ensure you’re collecting terrain data that’s truly fit for purpose, whether you’re planning new orchards, diagnosing drainage issues, or tracking landscape changes over time.
SfM photogrammetry (from RGB images):
Affordable and accessible.
Works well in open orchards with clear ground visibility.
Struggles in dense canopy cover, and does not “see” under trees.
LiDAR:
Penetrates canopy to capture bare‑earth terrain.
Higher accuracy in vegetated areas.
More expensive and requires specialised hardware.
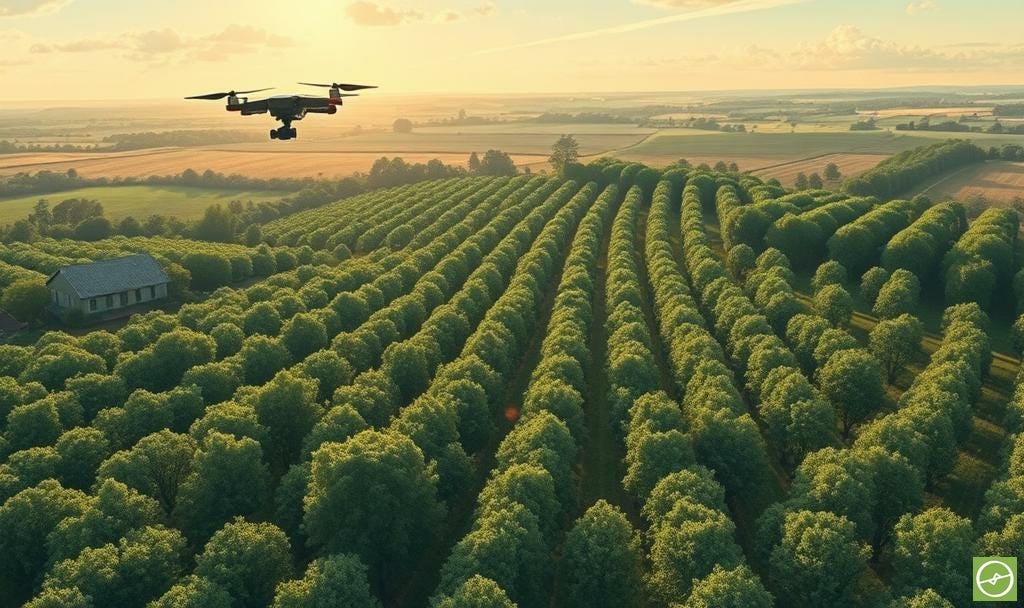
For most commercial orchards with standard row spacing, high‑quality SfM photogrammetry is sufficient.
5. Drone‑derived vs satellite‑derived DEMs — which should I use?
When deciding between drone‑derived and satellite‑derived DEMs, the trade‑off comes down to resolution versus coverage.
Drones capture fine‑scale detail ideal for orchard‑level planning, while satellites offer broader regional context but lack the precision needed for tree‑level insights.
Data availability can also be a factor too. High‑resolution satellite DEMs may be restricted, outdated, or expensive; whereas drone data is comparably accessible, and can be captured exactly when and where you need it.
Drone‑derived data:
Resolution: typically 3–10 cm.
Ideal for orchard‑level planning and in‑row diagnostics.
Captures micro‑variations that satellite data misses.
Satellite‑derived:
Resolution: typically 5–30 m.
Useful for regional planning or large‑scale watershed analysis.
Not detailed enough for precision orchard work.
If you need to plan drainage for specific blocks or diagnose tree‑level stress, drones win every time.
6. How can DEMs proactively identify erosion risk before it’s visible?
Erosion rarely announces itself until damage is done! But DEMs can reveal the early warning signs. By analysing slope, drainage patterns, and terrain breaks, you can pinpoint areas where water movement is most likely to strip away topsoil - long before visible gullies or sediment loss occur.
Slope analysis from DEMs can reveal:
Concentrated flow paths.
Steep sections prone to runoff.
Depressions where water slows, and area where topsoil erosion has already occurred.
By overlaying these with rainfall data and soil type maps, you can identify erosion “hot zones” before larger gullies form, or massive topsoil build up occurs where it shouldn’t.
7. What are the risks of neglecting DEM‑based analysis in infrastructure planning?
Infrastructure decisions set the framework for decades of orchard operations, and terrain plays a critical role in getting them right.
Without DEM‑based analysis, key assets like irrigation networks, roads, and storage facilities may be placed in locations that compromise efficiency, increase maintenance costs, or even create long‑term drainage and erosion problems that are costly to fix later.
Poorly sited irrigation lines that lose pressure or flood low areas.
Roads or tracks that channel water into orchards.
Buildings or dams placed in spots prone to flooding or unstable slopes.
Once built, moving infrastructure is costly — getting it wrong at the start can lock in inefficiency for decades.
8. How do DEMs optimise Variable Rate Application (VRA)?
Variable Rate Application (VRA) is usually built around soil fertility data, crop vigour and stress maps, or yield history. While these are important, they only tell part of the story.
Elevation dictates how water and dissolved inputs actually move across the orchard. And ignoring this can undermine even the most carefully designed VRA program.
On sloping ground, fertilisers, soil amendments, or crop protection products can migrate downslope with rainfall or irrigation. Low‑lying areas may collect excess nutrients or chemicals, while higher elevations may remain under‑supplied. This leads to inefficient use of inputs, uneven growth, and in some cases, environmental run‑off concerns.
By integrating DEM layers into your VRA mapping, you can model slope, flow paths, and accumulation zones, then adjust application rates accordingly. This ensures each zone receives what it can retain and use effectively. For example:
Reduce rates on slopes prone to leaching or run‑off.
Increase rates in elevated sandy soils where infiltration is fast and retention is low.
Modify application timing in depressions to avoid pooling or nutrient tie‑up.
The result is more precise targeting, better uptake, and reduced waste; with the added benefit of improved orchard uniformity over time.
Adding terrain information is an additional factor to consider, in terms of VRA strategy, but the longterm results far outweigh the efforts when done right.
9. Can DEMs predict stress zones when combined with NDVI or NDRE?
Absolutely. And the real power comes when you layer multiple metrics together for a more complete diagnosis.
Elevation alone can point to likely stress drivers, but pairing it with vegetation indices such as NDVI or NDRE confirms whether those terrain patterns are actually impacting plant health and vigour.
Elevation‑linked stress is a common theme in perennial crops:
Low zones → prone to excess moisture, poor drainage, oxygen‑limited root zones, nutrient leaching, and in some soils, heightened disease pressure.
High zones → more exposed to wind and solar load, with quicker moisture loss (quicker infiltration, evaporation, or low organic matter soils, etc) and greater drought stress risk.
When NDVI or NDRE maps highlight elevated stress in patterns that match terrain‑defined zones, you have a strong case for terrain‑linked intervention. But it doesn’t stop there.
From other data layers often readily available:
Thermal (Transpiration Uniformity): Low‑lying waterlogged areas often show low canopy temperatures due to reduced transpiration efficiency. Conversely, high‑elevation drought‑stressed trees may also run hotter.
Canopy Metrics: DEM‑linked stress zones often show smaller canopy area or reduced indicative vegetative volumes - a strong visual cue of chronic underperformance.
Historical Change Detection: Comparing DEM‑linked stress zones across seasons helps separate one‑off seasonal effects from persistent structural problems.
By integrating DEMs, NDVI/NDRE, thermal, and canopy data, you’re no longer just identifying “where” stress is happening… you’re understanding why it’s happening. That makes your in‑field scouting more targeted, your remediation work more effective, and your long‑term orchard planning more resilient.

10. What spatial resolution is “good enough” for orchard analysis?
3–10 cm: Ideal for tree‑level diagnostics and in‑row slope analysis.
<20 cm: Acceptable for block‑level planning and drainage mapping.
>50 cm: Too coarse for most precision orchard uses.
The tighter the resolution, the more confidently you can act = improved ROI.
11. How does DEM data influence financial decision‑making?
Irrigation investment: Direct funds to areas with the greatest water distribution challenges, ensuring capital is spent where it delivers the most benefit.
Variety selection: Match cultivars to terrain‑specific stress patterns, reducing long‑term losses from unsuitable plantings.
Infrastructure placement: Save money on rework by getting it right the first time — from roads to dams to pump stations.
Opportunity cost: Avoid tying up land, capital, and management time in underperforming zones by identifying them early and planning accordingly.
Labour and machinery efficiencies: Plan block layouts, access routes, and work sequences that minimise travel time, fuel use, and unnecessary equipment wear, reducing both input costs and wasted hours.
Drainage works: Prevent costly re‑installation by using DEMs to design systems correctly the first time, avoiding repeated excavation, material, and labour costs.
“Every drainage decision you get wrong today is a cost you’ll pay for twice — first in installation, and again in years of lost yield.” - Johnnie van der Walt, Precision Drainage
Better terrain insight reduces guesswork - and that directly affects ROI. Over the lifetime of an orchard, those savings compound into a significant competitive advantage.
12. How can DEM analysis be made more accessible in regions like Uganda or East Africa?
I understand that in many parts of East Africa, the challenge isn’t the value of DEM data - it’s access. By lowering the cost of collection and building local capacity to interpret terrain insights, even smallholder farmers can use elevation data to guide smarter, more resilient decisions.
Build and facilitate training around interpreting DEMs.
Offer shared drone services via co‑ops, or hardware share agreements.
Integrate DEM data into affordable mobile platforms for easier farmer access.
Partner with NGOs focused on climate resilience, sustainability, and food security.
Remember, digital is the great leveller when it comes to knowledge and solution access. Once the hardware solution is solved (data collection) it get’s easier from there on out. Then it needs to be assured that education on data use is not forgotten.
13. How can farmers be trained to interpret DEMs effectively?
Utilise available resources. Online info, courses, books, videos, etc.
Practical workshops using local case studies, and in-person meetings.
Side‑by‑side comparisons of RGB vs DEM outputs (ideally other metrics too).
Linking DEM patterns directly to in‑field observations and yield outcomes.
Practice through exposure - taking action!
Then, Intervention tracking, and continual feedback loops (which lead to additional talking points at practical workshops and think-tanks).
Follow‑up mentoring to embed the skills.
Final Thoughts
DEMs aren’t just “extra data.” They’re the missing terrain context that lies beside and together with every other orchard metric. From canopy growth to nutrient use. Ignore their utility at your own peril, and risk farming blind to one of the most influential factors shaping yield.
Thanks again for the questions, and enquiries - I appreciate you all.
All About Drone Data Metrics (mini course)

If you want to learn more about the core sets of drone data you can utilise for enhancing agricultural efficiencies, this free course is for you!