

Cool Trees, Hot Problems: The Thermal Metric Every Farmer Should Track
Unlocking Transpiration Uniformity: How thermal drone data exposes irrigation flaws, hidden stress, and wasted potential in orchards.

This post is part of the Drone Data Metrics section of the blog: A series exploring the practical ways in which aerial data is transforming orchard management.
If you’re new to the concept, think of drone data metrics as a toolkit: From simple canopy measurements and multispectral indices like NDVI and NDRE, through to thermal insights like Transpiration Uniformity (TU). Each metric adds another layer of understanding, helping farmers move beyond what the eye can see, towards actionable, per-tree decisions.

Making the Invisible Visible
Farming has always relied on the farmer’s eye.
We walk the orchard… and judge tree health by the shade of green, the fullness of the canopy, the uniformity across a block.
And for centuries, that was enough.
Remote sensing has taken this further. First with canopy statistics, and then with multispectral layers like NDVI and NDRE, by satellite, plane, and drone.
And with each passing year innovations have added to resolution and functionality. UAVs have now pushed these indices (and orchard management) toward the pinnacle of precision - for those who dare to grasp it with both hands.
This gives us powerful ways to measure vigour, chlorophyll, and canopy variance beyond what the human eye can detect. For many farms, those metrics are now core tools in managing orchard health.
But here’s the catch: canopy variance, NDVI, and NDRE still focus on how trees look in terms of growth and leaf reflectance. What they don’t show is how those trees are performing in real time in terms of transpiration. That missing layer is where thermal imagery steps in.
By mapping canopy temperature, drones measure whether trees are cooling themselves effectively through transpiration - or silently shutting down under stress. It’s either the lack of life giving water; or way too much of a good thing - and anaerobic conditions that could spell disaster.
The result is Transpiration Uniformity (TU) and its companion value Transpiration Variance (TV). These don’t replace canopy, NDVI, or NDRE insights; they add another dimension of truth.
Together, they create a more complete picture of how consistently an orchard is functioning above and below the surface.
Platforms like Aerobotics now provide these TU and TV metrics at a per-tree level, making the invisible visible in the most practical way possible.
With that, farmers are no longer left guessing about uniformity. They can measure it, monitor it, and act on it with precision.
What is Transpiration Uniformity?
Plants regulate temperature by transpiring. Water evaporates through stomata in the leaves, cooling the canopy.
If irrigation is consistent, soils are balanced, and roots are healthy, then trees across a block should transpire in a similar way. Uptake of nutrients from the root zone included.
But when some trees are not taking up water (and hence have hotter canopies) while others are actively transpiring, the orchard becomes patchy.
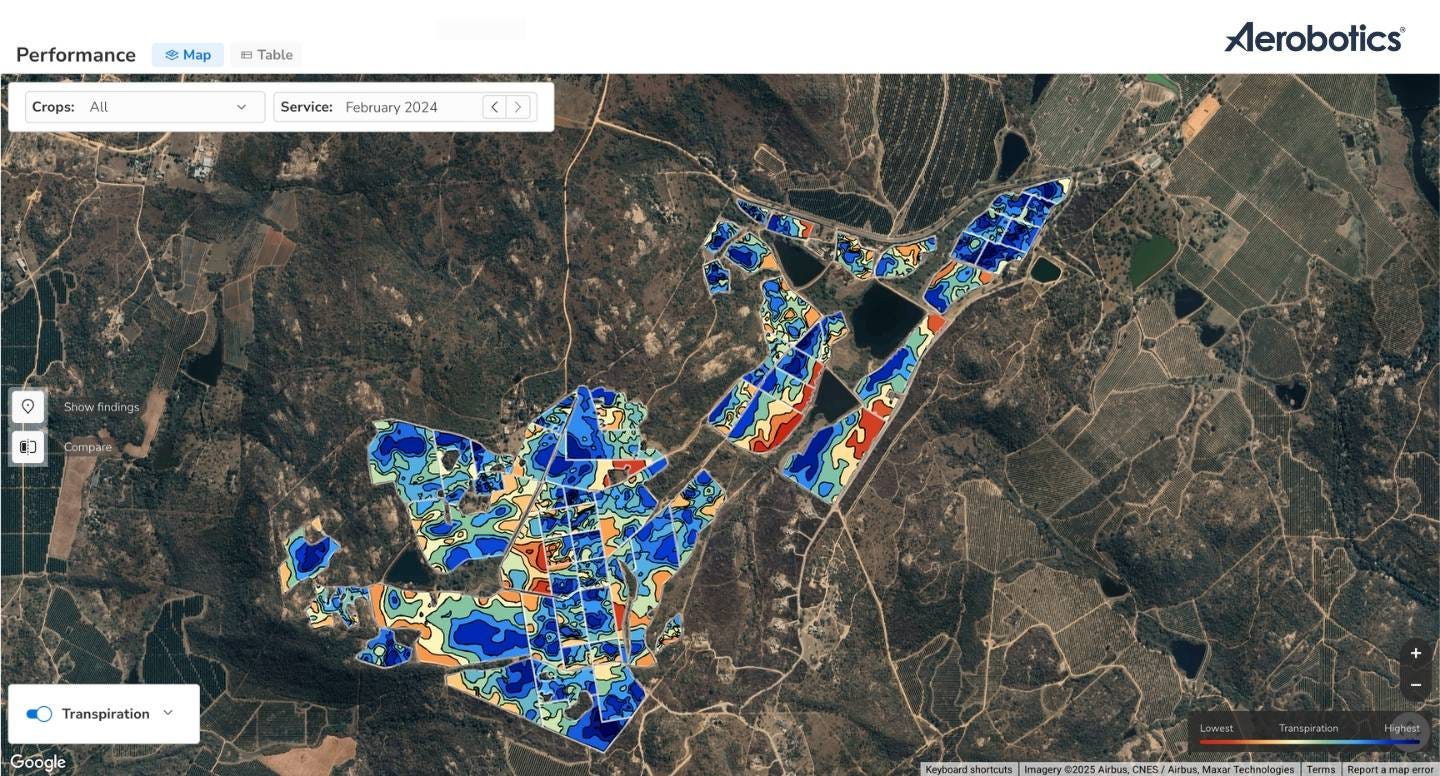
With the aforementioned Aerobotics platform for example, the drone scan results capture that variation in a single useful value. For example: note the Transpiration Variation value for the orchard in the image you’ve just seen above.
Translating TV values looks something like this:
Low variance (< 0.25) indicates uniform transpiration.
Good news - the block (and/or irrigation system) is likely performing consistently, with a good level of transpiration homogeneity.Medium variance (0.25–0.35) means irregularities are creeping in. Time to inspect. What does the zonal and per-tree data reveal? Look for patterns, outlier shapes, or linear lines of outliers as clues.
High variance (> 0.35) means the block is out of balance. Irrigation, soils, or plant health need immediate attention.
TV of 0.45 or greater is especially alarming. Unless there is a known and very obvious reason. Like newly planted trees vs mature trees, sever pruning (like stag-horning, or top-work grafting, etc) on trees coming up with very low Transpiration values vs normal/mature/unpruned trees in the same block.
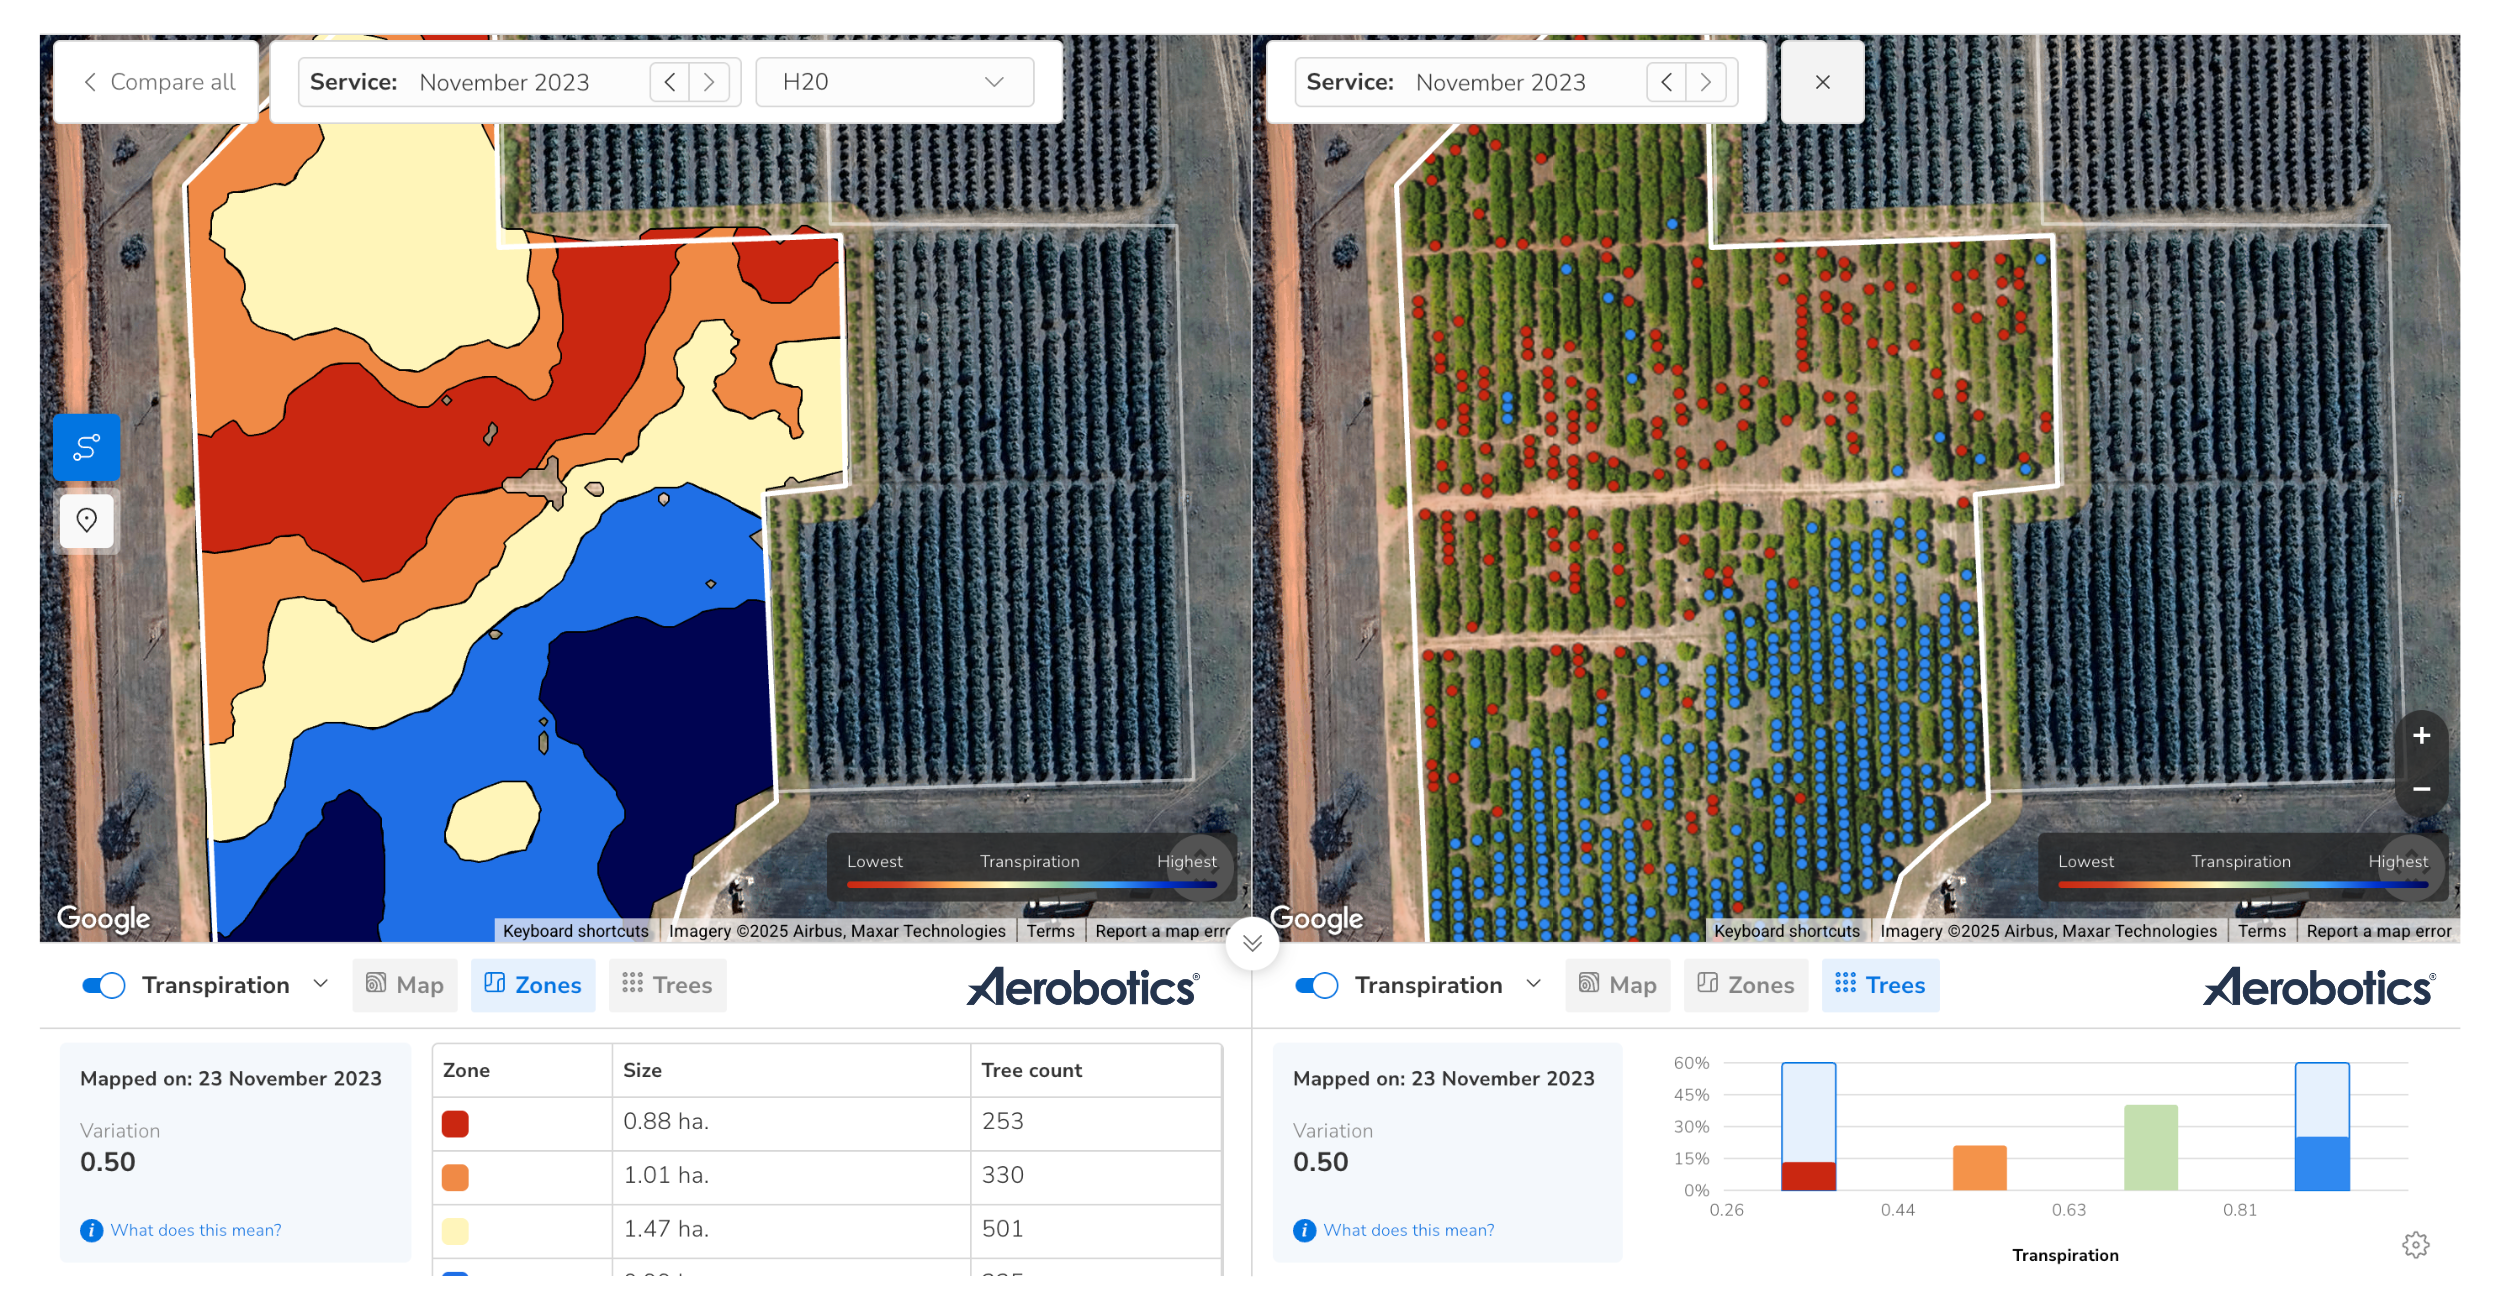
When Variance Hits the Red Zone: A Case at 5.0
In one citrus orchard survey, the Transpiration Variance (TV) value was recorded as 0.38, and on paper, this is just beyond the “high variance” threshold (>0.35). A TV value that flagged the block as a priority for inspection.
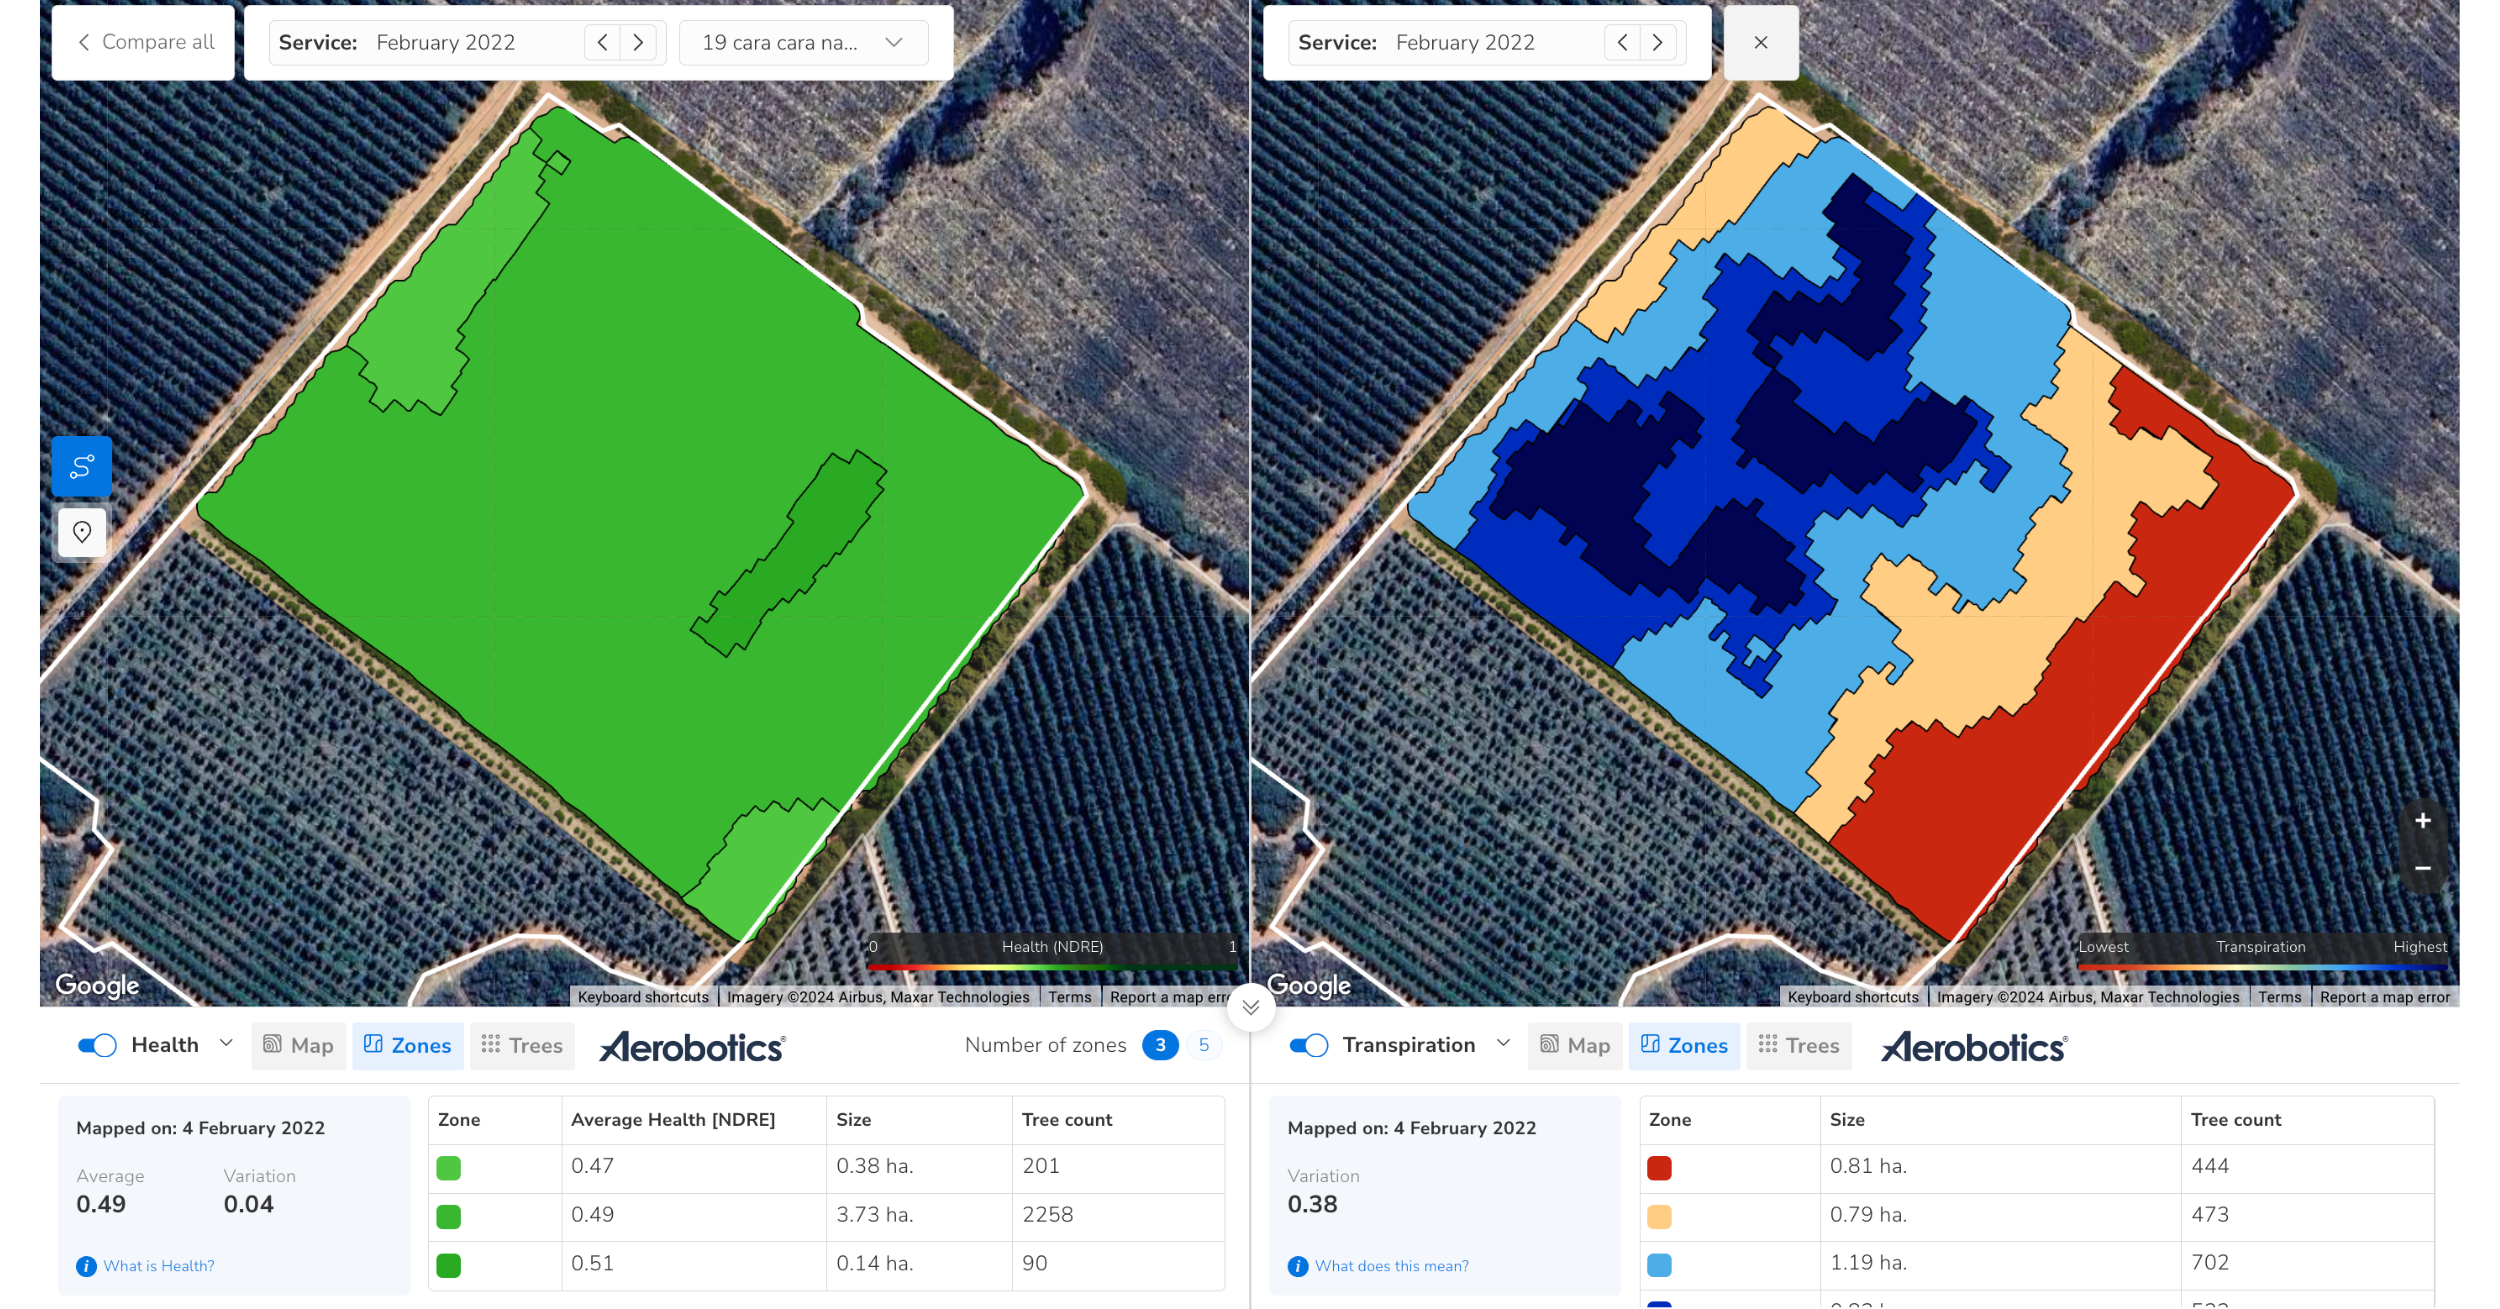
At a glance, the orchard looked uniform in terms of canopy size and NRDE (pictures above left). But the thermal data revealed a different reality: some trees were transpiring strongly and staying cool, while others were effectively shutting down, holding heat far above the block average.
The gap between the best and worst performers was extreme. A variance figure like this usually points to systemic issues.
It could be a faulty irrigation line, pressure drops across the block, or underlying soil conditions creating patches of poor root health. Whatever the cause, it is clear that the orchard cannot be managed effectively in the longterm without targeted intervention.
This example illustrates why TV is so powerful. High variance values act as an “alarm bell,” showing not just that problems exist, but that the degree of inconsistency is large enough to compromise yield and efficiency if left unaddressed.
“A high variance score is more than a number. It’s an alarm bell for hidden stress.”
From Numbers to Decisions: The Value of TU
Numbers on their own don’t change outcomes.
It’s what you do with them that matters.
Transpiration Uniformity bridges the gap between raw thermal data and practical orchard management. By translating canopy temperature differences into a clear variance score, TU gives farmers a decision-making edge. Pointing directly to where action is needed, and where resources can be saved.
Efficiency: Uniform transpiration means water, fertiliser, and energy inputs are being used as intended.
Early warnings: TU highlights issues before they escalate into yield loss - often within the same season, depending on the drone scan timing, and how swift the intervention.
Targeted inspections: Instead of scouting every block blindly, farmers can zero in on specific hotspots or linear patterns; that when compared to other drone data metric values aid in diagnosis.
Resilience: Consistent transpiration is a proxy for resilient orchards, better able to handle heatwaves, water shortages, crop loads, and disease pressures.
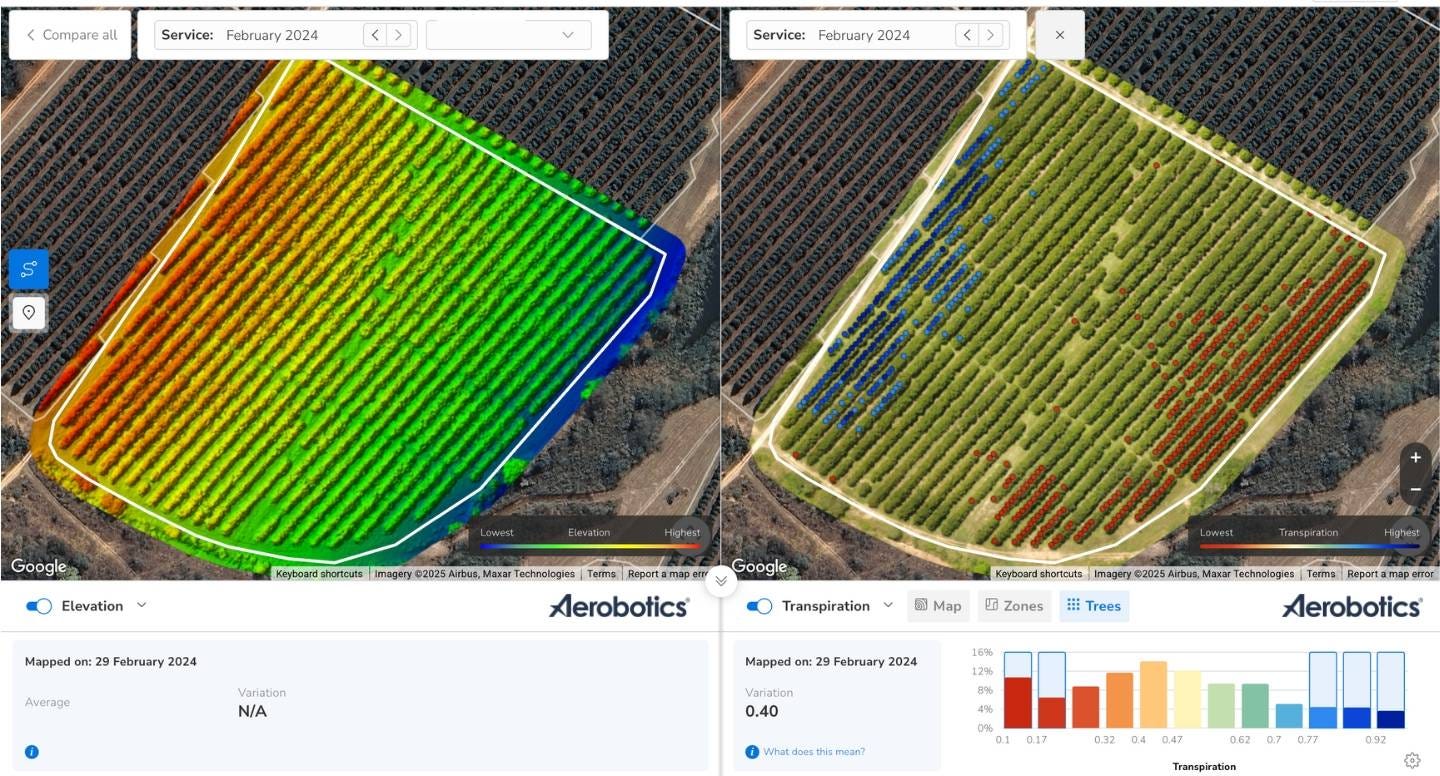
In the above image, a 0.40 TV prompted investigation (online) and data comparisons suggest gradient related limiting factors. These are validated with a second - and targeted - investigation (in-field) to gather additional information ahead of interventions as part of the orchard management plan.
In short, TU transforms invisible patterns into actionable insights.
By tracking it over time, farmers can move from reactive firefighting to proactive management; ensuring orchards stay balanced, efficient, and ready to deliver sustainable and consistent yields.
When Uniformity Becomes Opportunity
Transpiration Uniformity gives farmers a lens into the unseen.
It shows whether the orchard is working as one, or whether some trees are quietly falling behind.
Numbers don’t lie, and TV numbers that creep upwards… tell a story of imbalance that must be fixed, as soon as possible.
This does not diminish the importance of canopy statistics, digital elevation models, or multispectral values. Those remain essential for gauging growth, ground level characteristics, stress, vigour, and health.
But Transpiration Variance adds a layer that many overlook. The live performance of trees under irrigation and climatic pressure.
It’s the difference between seeing that your orchard is balanced… and knowing whether it is functioning as a balanced system.
If you’re serious about making drone data work for your farm, TU is one of the most valuable metrics you can add to your toolkit.
The thinking starts here, but the real change starts when we take action.
Want to go deeper into thermal imagery, NDVI, NDRE, and more?
I’ve built a free 7-day email course on Drone Data Metrics, complete with a downloadable eBook, to give you the tools and examples you need.
Start the free mini-course and put drone data to work on your farm.
You can also find more on this topic in Chapter 8 of my book “Drone Data Metrics for Orchard Farming”.
Further Reading & Resources
What Are Anaerobic Conditions and How Do They Affect Crops? – Hortau
UAV Thermal Imaging for Irrigation Efficiency – ScienceDirect
Systematic Review: UAV-based Thermal Remote Sensing in Agriculture – Taylor & Francis