

UAV Data in Macadamia Orchards; Turning Variability into Margin
How drone-derived, per-tree insights can help macadamia farmers move from blanket decisions to targeted action, protecting margin in a volatile season.

Margins in macadamias are not what they used to be.
Input costs have climbed. Pest pressure has become a complex problem. Seasons feel less predictable than the climate charts might suggest.
At the same time, more and more orchards are entering serious production age. Small decisions made now, will compound into big outcomes over the next decade.
When I sit with macadamia farmers, one theme keeps surfacing:
Orchard blocks are increasingly variable. And for simplicity sake, and ease of management, most decisions are still made as if blocks are uniform as standard.
That gap between reality and response is where margin is lost.
While UAVs and drone-derived data are not the silver bullet we might be hoping for - they do give us something we haven’t really had before at scale: a fast, repeatable way to see and define variability clearly and provide applicable insights that help us to respond at the right level. Not just by block. Often by zone. Sometimes tree by tree.
In this post, I want to unpack how UAV data can help macadamia farmers specifically in turning variability into margin, and share a simple decision loop that makes the data a whole lot more practical.
Variability as the new baseline
A few decades ago, it was perhaps easier to think of a block as a single unit. Climate patterns were arguably more stable. Orchards were younger. Data was limited to what you could see and feel. At best, what you had written in a notebook.
Today, the picture has changed.
Farmers tend to describe it in different ways:
“This corner pulls us down every year consistently.”
“That top side looks tired, even when the rest of the block looks fine.”
“We fix one problem in this block and then another one pops up.”
Climate variability shows up as hotter spells, uneven rainfall, late cold snaps, or thunderstorms that dump 50mm on one part of the farm and almost nothing on another.
Trees do not respond to the average rainfall figure for the month. They respond to what actually happens in their root zone and their microclimate. They respond to the realities of their environment.
Layered on top of the climate factor is pest and disease pressure. As we all know, stressed trees become softer targets. Zones with poor soil, drainage issues, compaction, or inconsistent irrigation start acting as early-warning pockets. Weak areas become hosts for bigger, block-level problems later on. Problems that either spread, or simply impede the farming operation from reaching full potential.
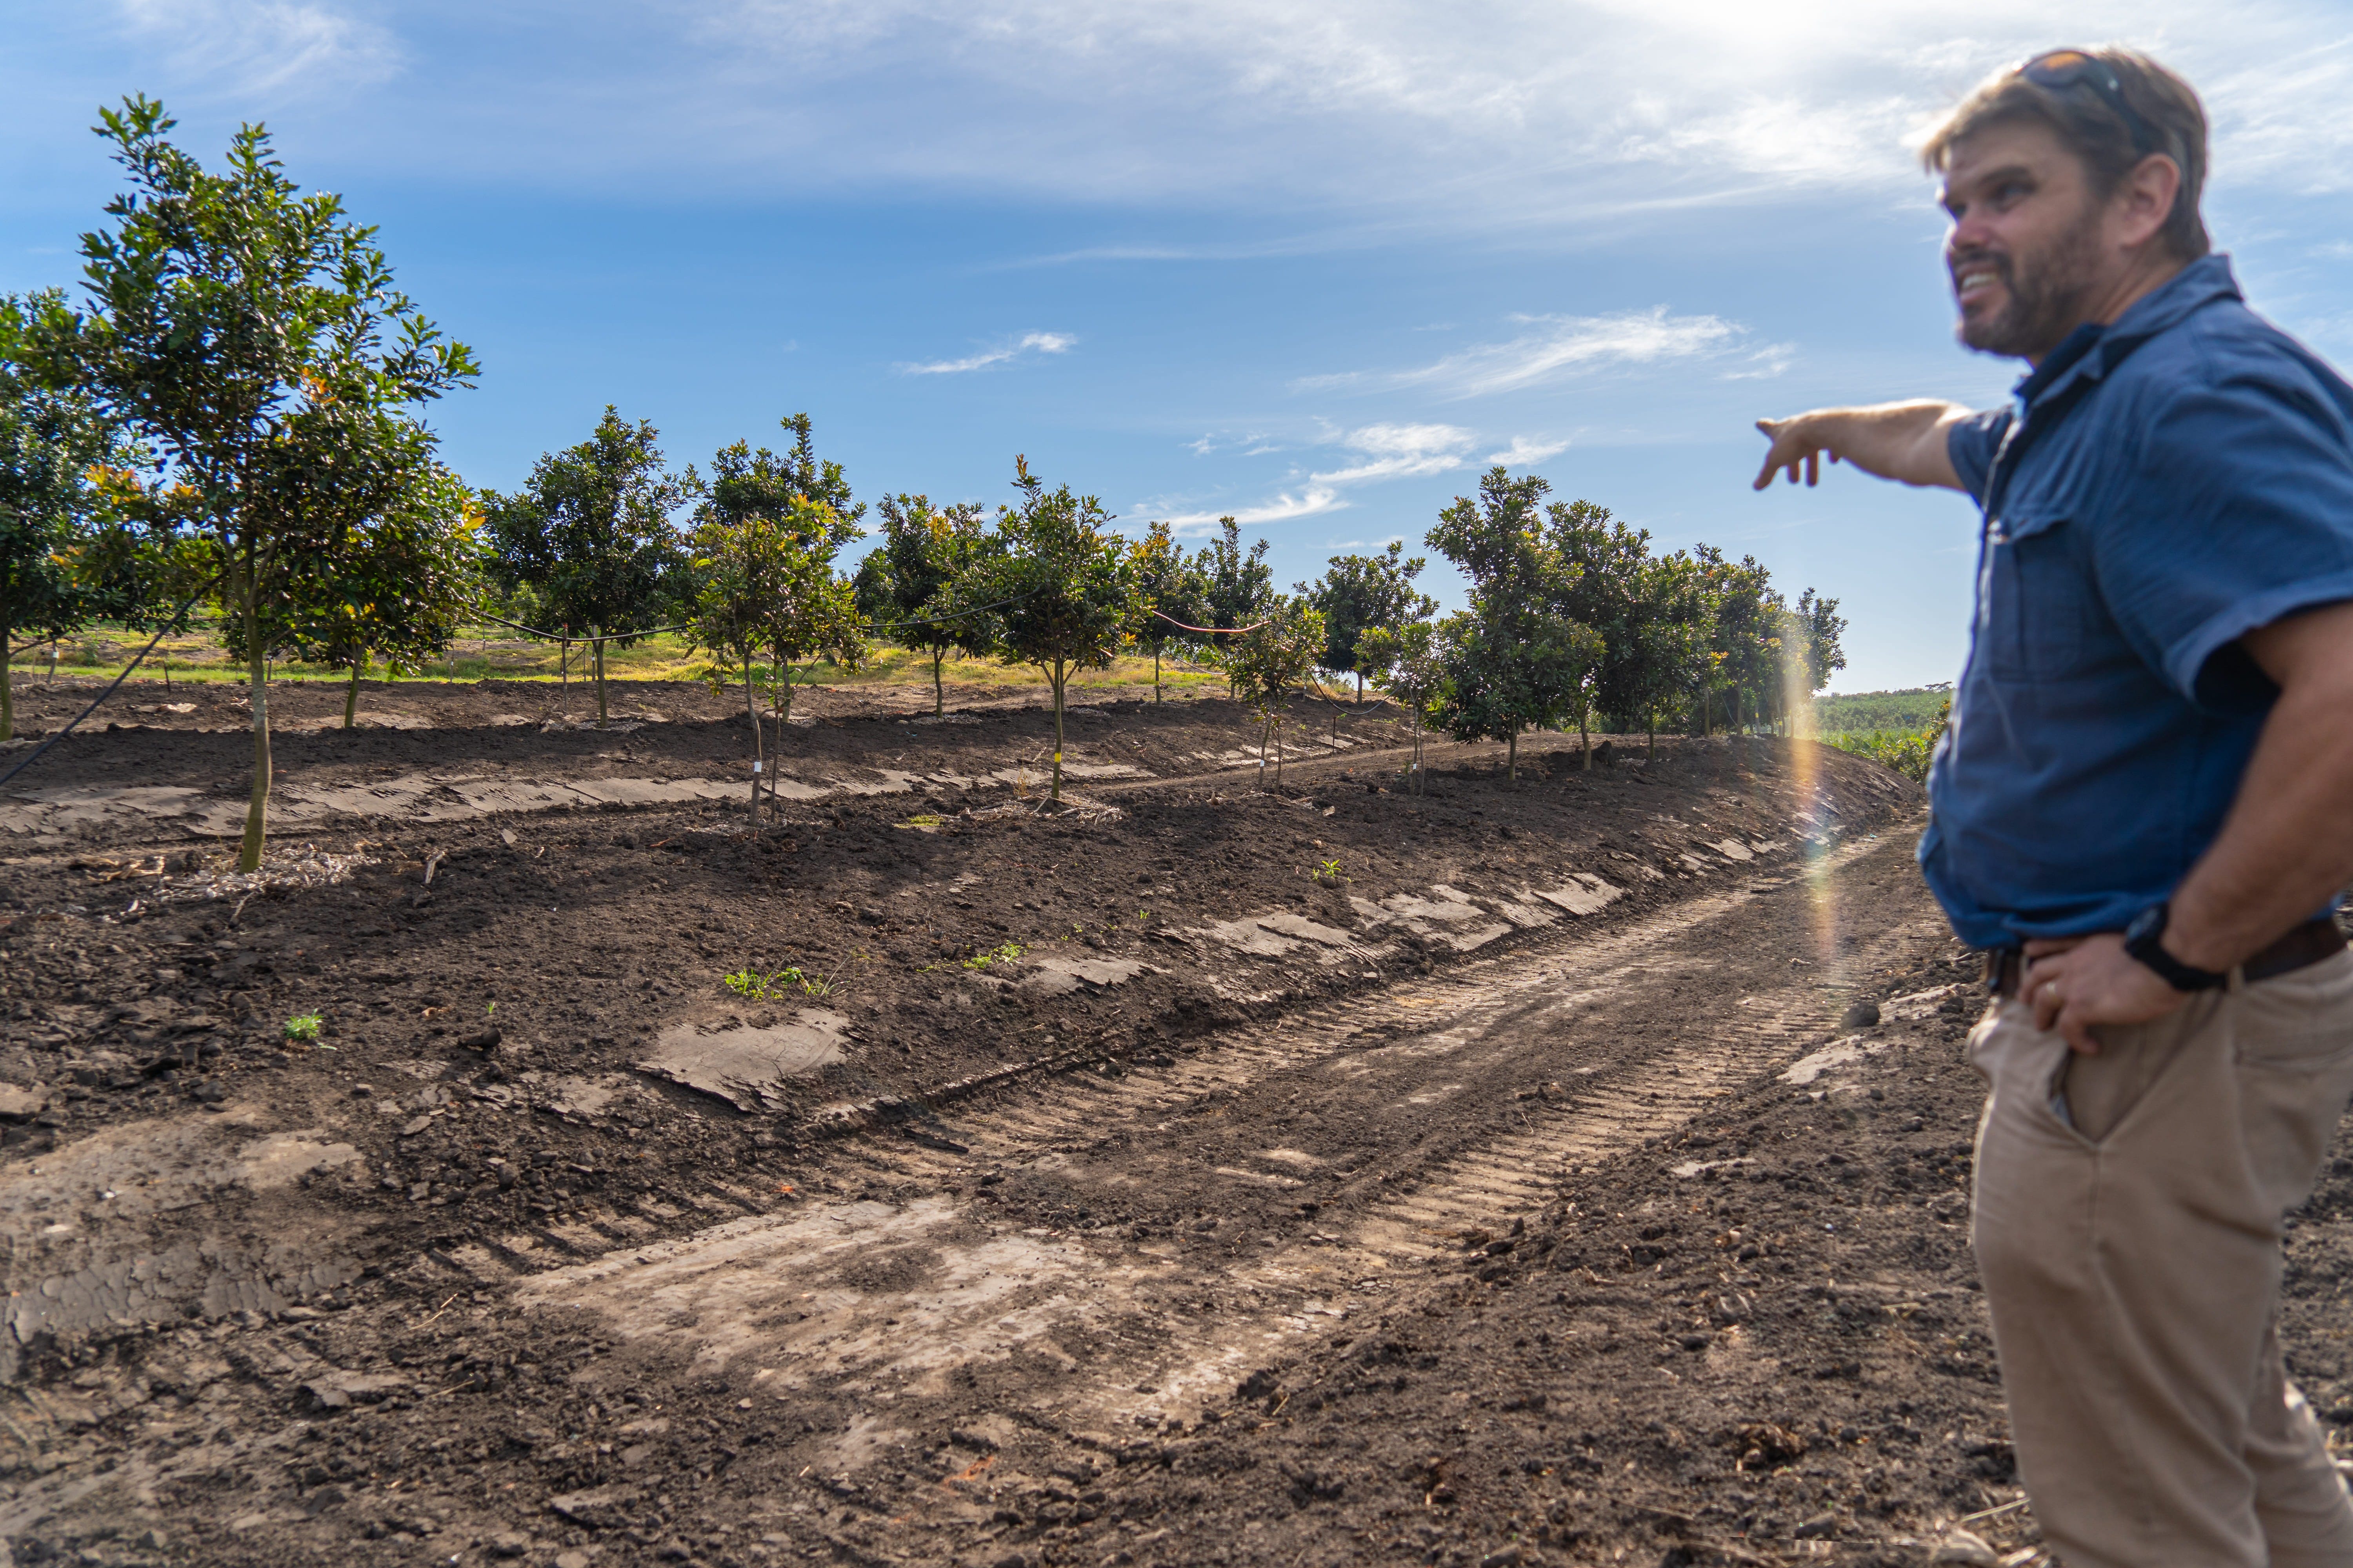
From the ground, this is easy to underestimate. You drive the main road, walk a few rows, and your brain fills in the gaps. The block looks “mostly okay”.
However, from the air, the variation is hard to ignore. It stares you in the face.
Looking at drone data metrics results, different vigour or tree health bands often appear inside the same planting. Tree size is uneven. Thermal patterns reveal hot spots that never show up in a quick visual inspection.
Even in well-managed orchards, hidden variation is usually there if you look for it in some shape or form - it’s the norm, not the exception.
The old mental model of “one block, one decision” is increasingly out of sync with the realities of what is needed in terms of management.
How margin quietly leaks away…
When I talk about margin in this context, I am thinking about far more than the final tons per hectare on farm, or the price per kilogram at the factory. Margin erodes in smaller, quieter ways long before the crop is even harvested and delivered.
Three types of “leakage” stand out.
1. Input inefficiency
If chemicals, fertiliser, and water are applied evenly across a block that is not even, some trees will inevitably receive more than they need and others less than they require. Strong zones are over-serviced. Weak zones are under-serviced.
The invoice does not show this imbalance. The orchard performance does.
2. Timing inefficiency
Late detection is expensive. The longer a pest hot spot, water stress, or nutritional issue is allowed to develop, the more aggressive and costly the intervention tends to be.
Something that comes to mind is how I’ve seen this first hand in the Table Grape industry - particularly in South Africa. Grape vines as we know, being a deciduous crop, farmers need to keep on top of things in their comparatively short growing window. Farmers in areas like the Breede Valley do this extremely well, prioritising pest and disease monitoring along with effective intervention timing.
For those in the Macadamiasphere, working on perennial crops means you would do well to take a leaf from their book. Because getting detection and intervention timing wrong has effects that echo and reverberate into future seasons for years and years.
Spoiler alert: visible symptoms are often the last stage of a process that started months earlier. That’s why I am so in favour of regular and methodical in-field scouting paired with drone surveys - which together are powerful for early detection and making sure you do not miss anything.
3. Confidence inefficiency
When results are uneven, confidence drops. Farmers become cautious about investing / spending. Interventions are delayed or reduced.
In other cases, frustration pushes decisions in the opposite direction, and overcorrection sets in. Also costly.
Thus, uncertainty has a cost of its own. It shows up in slow reactions, conservative plans, or missed opportunities, as well as overcorrection.
None of this is about a lack of effort. It is about visibility, scale, and delivery. You cannot target what you cannot see, and you simply cannot see everything from the ground alone, or by a quick look out the window.
Ken: There is so much to unpack here, and although this post in non-exhaustive, I want to get at least a good amount down in writing to provide you will some solid value, hints and tips, and something to think about - so bear with me.
Thanks for reading!
Every tree counts: Why per-tree thinking is worth the effort
Macadamias are long-term assets. Each tree is a capital investment that should ideally pay back over many years. Averages land up causing a blur to that picture.
A block that looks “fine” on a spreadsheet might contain:
a meaningful minority under real stress,
a large number sitting on the edge of acceptability,
a group of trees performing very well, mostly outliers.
If we treat all of them the same, we will always be partly right and partly wrong. Per-tree thinking does not mean managing each tree individually. That would be unrealistic, particularly at scale. It means using tools that help us describe and group trees more accurately so that management can be more precise. UAV data gives us a way to do that without walking every row and guessing.
I cover drone monitoring techniques and strategies for precision scouting and sampling in my book “Drone Data Metrics for Orchard farming”.
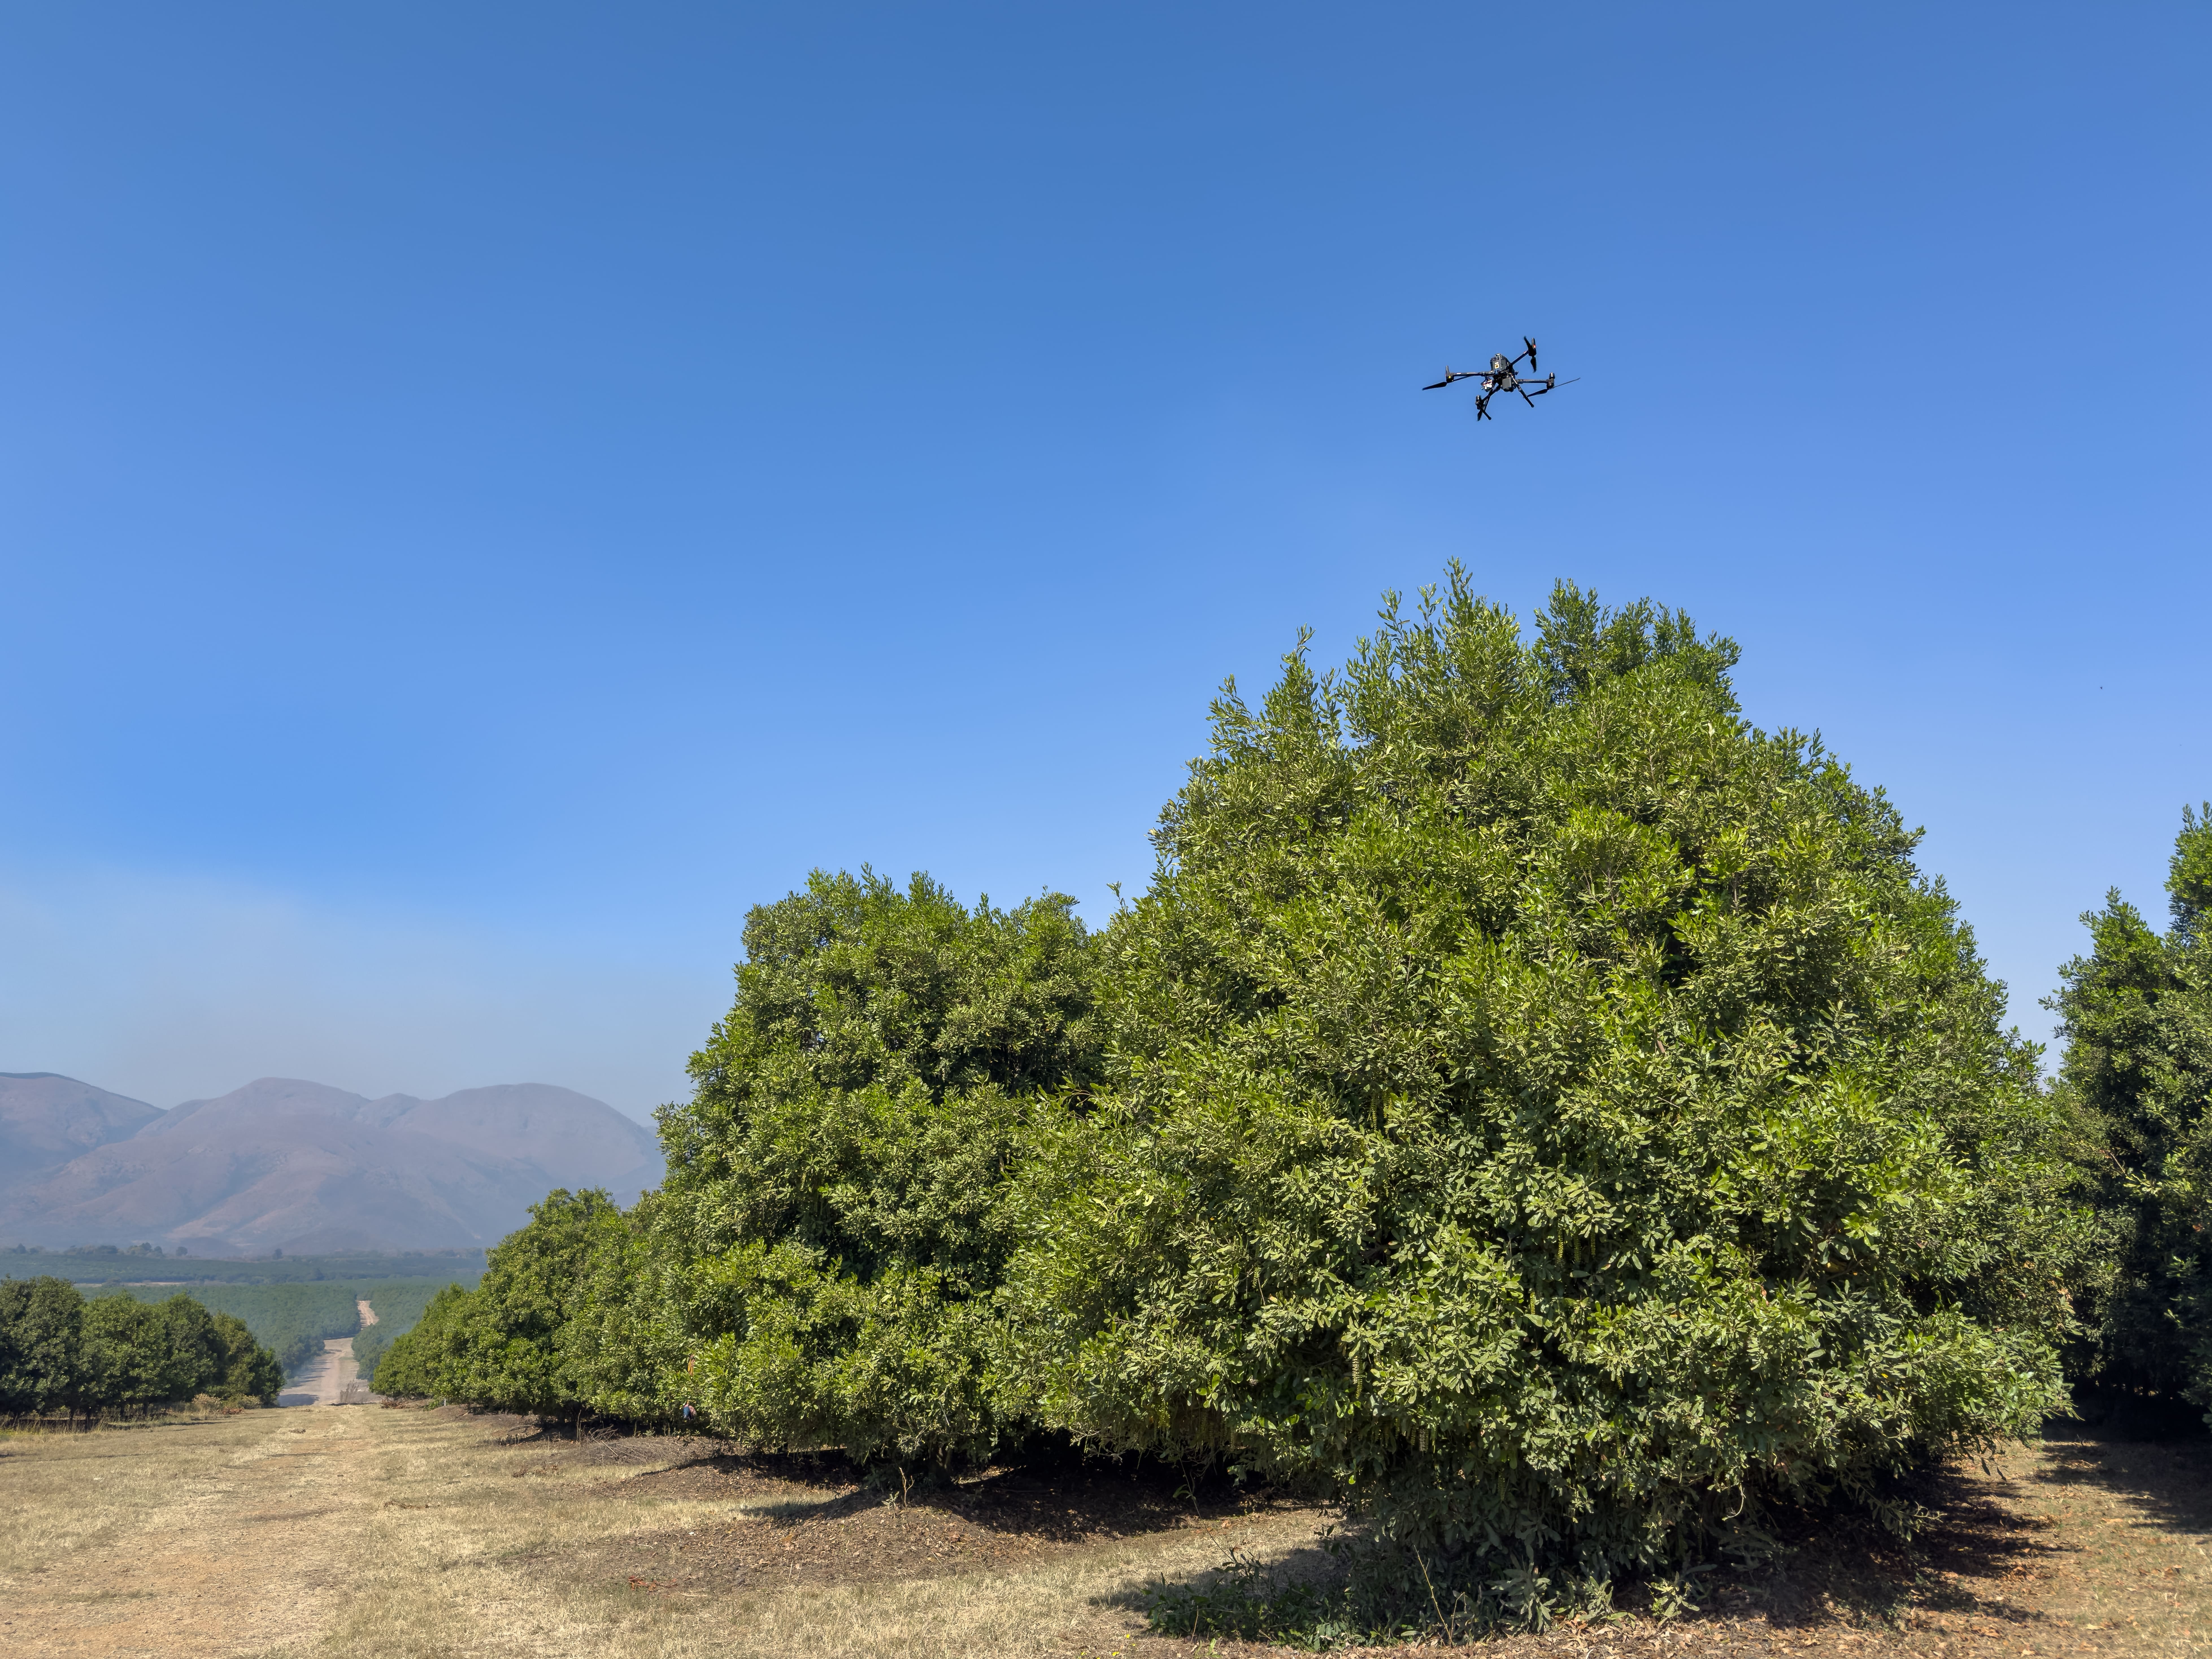
What UAV data actually brings to Macadamia orchards
A well-planned UAV survey captures several useful layers in a single flight. In practice, some of the most valuable layers for macadamias are:
High-resolution RGB imagery
The “normal colour” view that shows canopy shape, gaps, missing trees, weed pressure, and visible stress signatures. It often reveals spatial patterns that are difficult to see from ground level.Multispectral indices such as NDVI or NDRE
These indices help quantify relative vigour and canopy health. They can highlight subtle declines that do not yet show up clearly in RGB imagery or in yield data.Thermal imagery
Where available, thermal data adds a view of canopy temperature and potential water stress. Hotter zones may point to irrigation shortfalls, distribution problems, or soil constraints.Canopy area and volume per tree
Structural metrics that answer simple but important questions. Is each tree filling the space it has been given. Are there development gaps. Are certain rows lagging.Tree counts and stand density
A reality check for the inventory. Empty spaces and missing trees break the yield potential of a block, no matter how well the remaining trees perform.
Viewed separately, these are data layers. Combined, they form a story about how the orchard is working. With the right sampling strategy and ground-truths, they move from “interesting” to “actionable” in a really big way.
Free Course: Drone Data Metrics
·Learn about the core drone data metrics to utilise for enhancing agricultural efficiencies. Join for free and receive the accompanying eBook, and an email a day for a week - each lesson packed with info on drone-derived stats for Precision Agriculture.

A practical management loop:
The risk with any new data source is that it becomes another dashboard to feel guilty about. To avoid that, I like to keep the core workflow simple:
Detect.
Prioritise.
Act.
Verify.
Repeat
If a UAV programme supports the first four steps, it is probably adding value. If it does not… it’s nothing more than noise and distraction. Most likely, a poor use of resources. Most definitely, a bunch of missed opportunities. Pairing the right service provider with an in-house tech champion (expertise and/or ambition) will help a ton and make sure there are no regrets come drone survey.
Let’s walk through the management loop steps that will help you to fight variance and make sure you come out on top:
DETECT
The first task is to detect variation and potential issues early.
Examples might include:
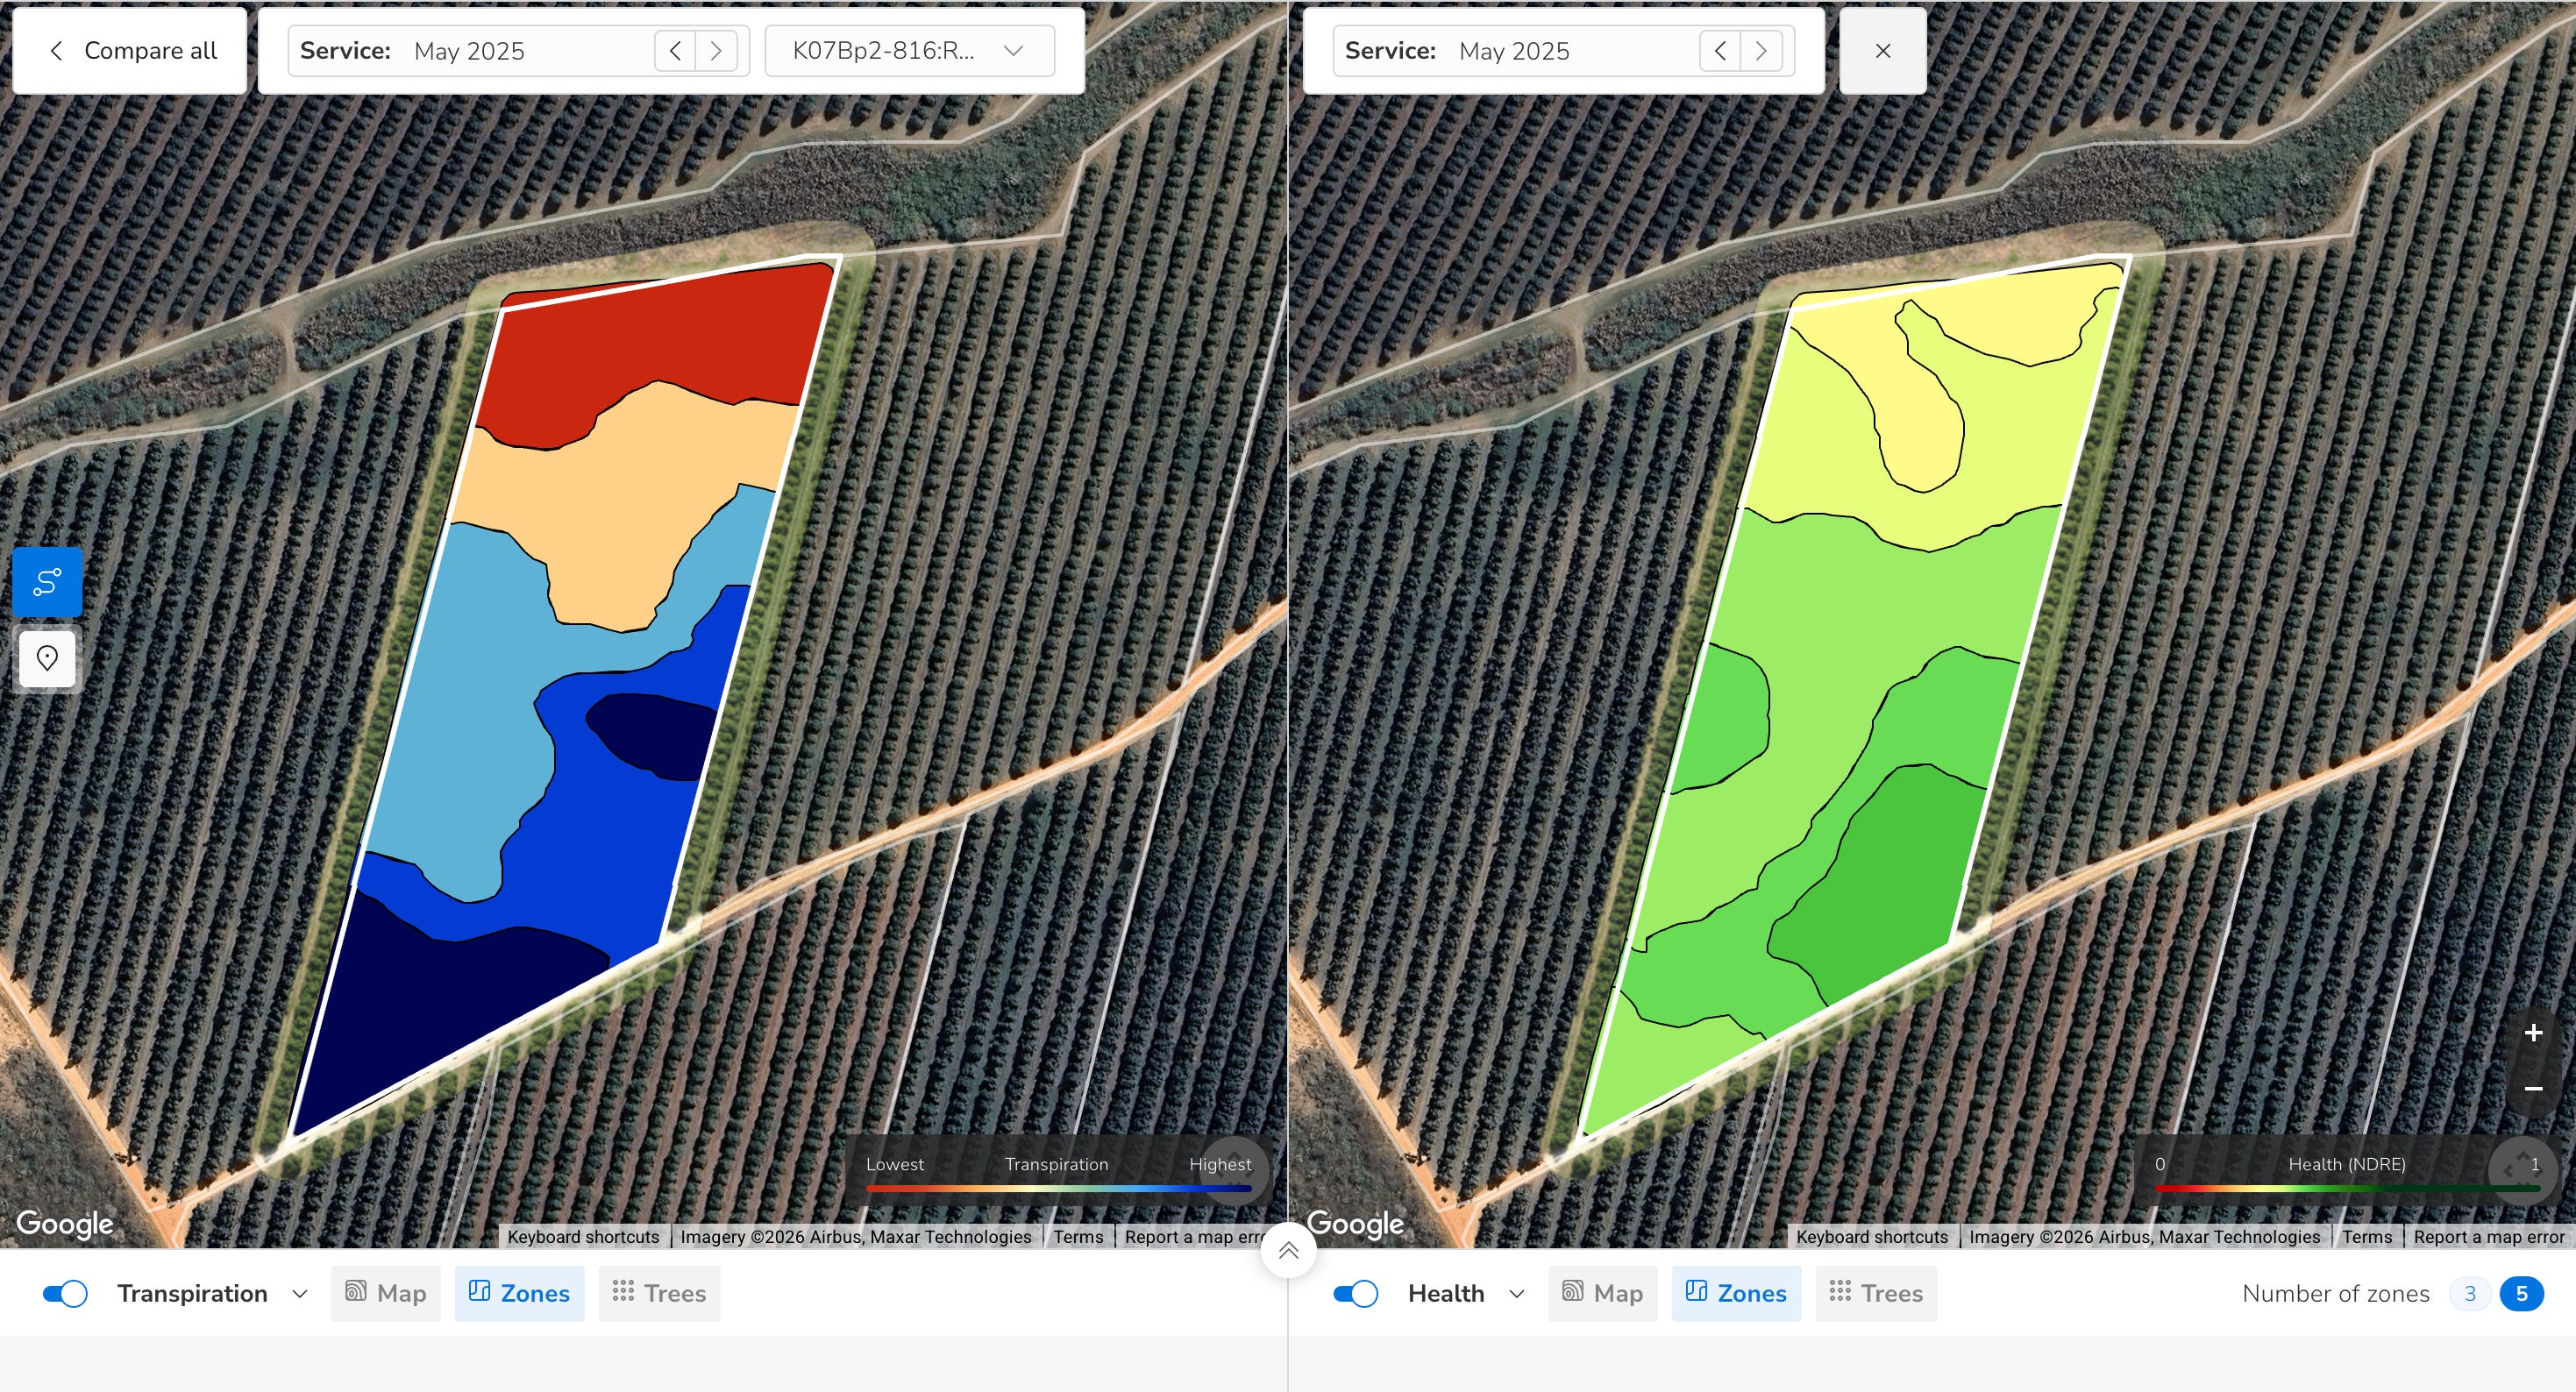
Zones that consistently show lower health (elevated stress) in multispectral maps.
Thermal patterns that reveal hotter areas (low transpiration) on key days.
Sections where canopy area is underdeveloped compared with the rest of the block, and vice versa.
Unexpected decline or missing trees that have slipped through normal checks.
Step 1 is not about diagnosing everything from behind a screen. It’s more about setting up a chain reaction of well-planned management events:
Deciding where to look more closely (see step 2) where to send your best people first and what they should do (step 3) and in quantifying both extent of the problem and any intervention results (step 4) along with how to proceed from there - ie. the follow-up survey (step 5).
PRIORITISE
Once variation has been detected, located, and quantified; the next step is to decide on what matters most. This is where smart sampling helps.
Instead of sending staff or consultants into a block with a generic brief, we can:
Identify clusters of weaker trees and treat them as distinct zones.
Select representative trees from different multispectral or thermal bands.
Mark out high-risk pockets that deserve more frequent checks.
Create a simple map of “must visit” points for field teams.
The purpose is to avoid treating every part of the orchard (or farm) as equally urgent. Some problems can safely wait a day, or even weeks. Others simply cannot.
ACT
Only now do we act.
Because we’ve already detected (1) and prioritised (2), actions become a whole lot more targeted. That might look like:
Directing scouting efforts towards flagged clusters instead of walking entire blocks evenly.
Adjusting irrigation scheduling or pressure in specific zones where thermal and vigour data point to stress.
Focusing pruning work where canopy structure is holding trees back.
Revising and refining targeted nutrition plans for the parts of the orchard that consistently underperform.
Farm teams usually feel the difference quickly. Labour and other input resources are spent where they have the best chance of moving the needle.Days are shaped less by routine and a lot more by data (evidence) and focus (action plans).
VERIFY
The final step closes the loop ahead of the next one.
After an intervention, we should ask a basic question: Did it work?
A follow-up UAV flight, combined with field observations, can help answer that. It can show whether canopy temperatures have normalised, whether weak zones are recovering, and whether new hot spots are emerging.
Over multiple seasons, this builds a record.
Patterns become clearer. Conversations with advisers and processors become more grounded. Risk is lowered over time - resilience is naked right in with every new loop. Moreover, investment and spending decisions become much easier to defend.
If you’re a manager, it will feel like you’ve got your whole world in order. What a feeling!
REPEAT
The loop only works if you run it more than once.
It’s meant to be a flywheel; not a one-trick solution.
A single UAV survey and a once-off set of actions will give you a useful snapshot - no doubt about that. However, it will give you neither resilience nor a steady on-going repair for leaking margins. That comes from rhythm. From flying, fixing, re-flying, refining, and re-refining.
Repeating the loop across seasons turns isolated insights into a management habit:
Detect again; has the pattern shifted?
Prioritise again; are the same zones still the worst, or have new ones appeared?
Act again; with sharper, more confident interventions. How can we do better?
Verify again; capture the impact and feed it back into the next set of decisions.
Over time, “repeat” is where the real value compounds. And who doesn’t love an investment with compound interest?
You start to see the orchard differently. You recognise early warning signs. You know which blocks behave badly under stress and which ones hold steady. You stop reacting and you start pre-empting.
Run this loop often enough and variability stops being a vague threat in the background. It becomes a map. A map you can read, respond to, and use to protect margin when it matters most.

3 familiar situations where UAV data protects margin
To make this more concrete, and as we move closer to the end of the post..
Here are three possible orchard situations where UAV data can make a noticeable difference:
1. The warm corner on the slope
A mature block on a gentle slope has gradually become inconsistent. Yields from the top corner keep sliding, but there are always more urgent issues elsewhere. The problem is labelled “difficult soils” and quietly accepted.
Thermal imagery shows that this corner regularly runs warmer than the rest of the block - low transpiration values. NDRE and NDVI indices confirm it’s also weaker. Follow-up inspections reveal uneven water distribution and compaction from repeated machinery traffic.
Instead of increasing irrigation across the whole block, the team focuses on this specific area. Dripper checks, line repairs, traffic pattern changes, and soil work start to shift the trend. It is not a quick win, but it stops a long, slow decline from becoming a permanent one.
2. The creeping pest problem
On another farm, pest control has become more expensive and less predictable. Scouts are busy, yet damage levels, unsound kernel, and rejection rates are creeping up year after year.
High-resolution UAV imagery and per-tree health metrics reveal that early infestations tend to cluster around specific low-NDRE pockets. Those weak clusters act as starting points, seeding problems into surrounding trees as the season progresses.
With that insight, the scouting plan is reworked. Scouts visit those clusters and their neighbours first. Monitoring becomes more focused and, where needed, control measures are applied slightly earlier in the places that matter most.
The total treated area may not change dramatically, but timing and targeting improve. Over time, that stabilises both cost and quality.
3. The “future block” that cannot wait
A younger planting on the farm is earmarked for the future. Because it is not yet a top earner, and as can often be the case, it tends to live at the bottom of the priority list. The main focus stays on the big, established blocks.
UAV data shows that canopy development in the young block is patchy. Some trees are racing ahead. Others are standing still. A handful of planting spots are empty.
By treating this block as a data priority now rather than later, the team can correct issues while the cost of correction is still relatively low. Planting gaps are filled. Underperforming rows are investigated. Establishment practices are adjusted.
This does not show up directly in this season’s cash flow. But does strengthen the long-term margin story of the farm over time.
Adoption reality: start focused, not perfect
The most common concerns I hear about UAV data are not about whether it is useful. They are about cost, complexity, and the fear of adding “one more system” to already full days.
Those concerns are reasonable.
A practical way forward is to start focused rather than trying to cover everything at once:
Choose one or two blocks with known variability or suspected hidden issues,
Schedule a UAV survey at a sensible time in the season,
Focus on a small set of metrics in year one, such as NDRE zoning, canopy structure, and basic thermal variation,
Use these outputs to guide a more intentional scouting, agronomy, and irrigation review process,
Make one or two targeted interventions and verify their effect.
If that small pilot does not improve decision quality, it is a signal to rethink the approach. If it does, it becomes much easier to scale and to integrate into existing workflows.
For those who want a structured framework for this, my book Drone Data Metrics for Orchard Farming is built around exactly these questions. It is not a hardware catalogue. It is a guide to turning drone-derived metrics into real orchard decisions in perennial crops, macadamias included.
From farm to factory: Why this matters beyond the orchard gate
Variability does not vanish once nuts leave the farm. Processors feel it in fluctuating kernel recovery, shifting style profiles, uncertain supply, and more complex sorting challenges.
When UAV data and good farm records come together, they can create a shared language between orchard and factory. Upstream per-tree and per-zone insights can be linked to downstream batch and consignment performance.
Over time, that opens space for:
Improved forecasting of volume and quality,
Informed cultivar and block renewal decisions,
Incentive structures that reward consistent management,
Closer collaboration on risk and opportunity.
The same tools that protect margin on farm can support more stable, transparent value creation along the macadamia value chain.
An invitation to continue the conversation
If this way of thinking about UAV data and variability resonates with you, and you would like to explore it further, I will be speaking at the AmberMacs Macadamia Expo in February.
The session is titled:
“UAV Data in Macadamia Orchards; Turning Variability into Margin”
We will unpack real orchard examples, walk through practical survey and sampling options, and explore how to plug UAV-derived insights into your existing IPM, irrigation, and canopy management practices without drowning in dashboards.
The organisers will also be giving away three hardcover copies of the book as part of the event prizes. If you would like to discuss how these ideas could apply in your own operation, come and find me at the expo. I will be there to learn as much as to share.

What is one area of variability in your own orchards that you suspect is costing you margin, but you have not yet measured properly?
The thinking starts here, but the real change starts when we take action.
Best regards,
Ken